By Yijun
One of our users performed a stress test on their project and found that queries per second (QPS) on a single thread was around 100 when the CPU was 100% used. Our customer wanted their project to be further optimized. After connecting the project to Node.js Performance Platform, we obtained the CPU Profile during stress testing to see what is using the CPU:
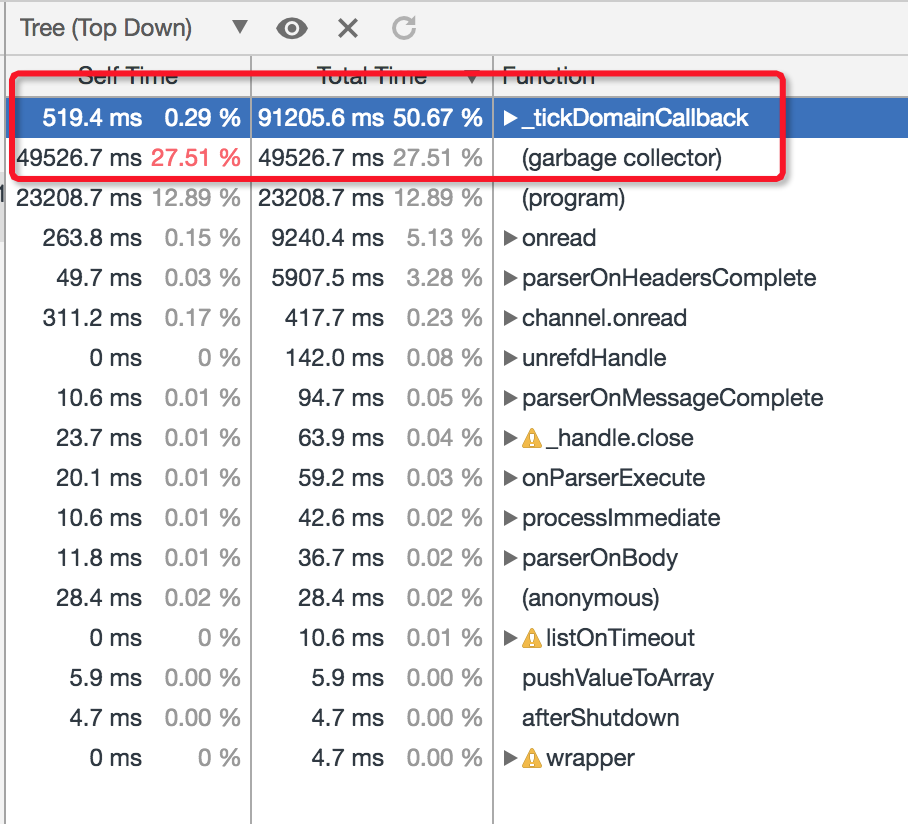
As shown in the preceding figure, _tickDomainCallback and garbage collector collectively used up to 83 percent of the CPU. We worked together with our customer and found that the typeorm and the controller logic in _tickDomainCallback used a significant pertange of the CPU. It is inconvenient to upgrade typeorm due to changes with the related API action. Moreover, the controller is already very optimized and doesn't show much prospect for further improvement.
As a result, the best option is additional GC optimization for better performance. During three minutes of CPU sampling, calls in the GC phase accounted for up to 27.5 percent of CPU usage. We observed the monitoring data in the Performance Platform and found that the scavenge phase was the main cause of this high percentage. We continued our online stress testing and performed a GC Trace operation to collect more information about GC.
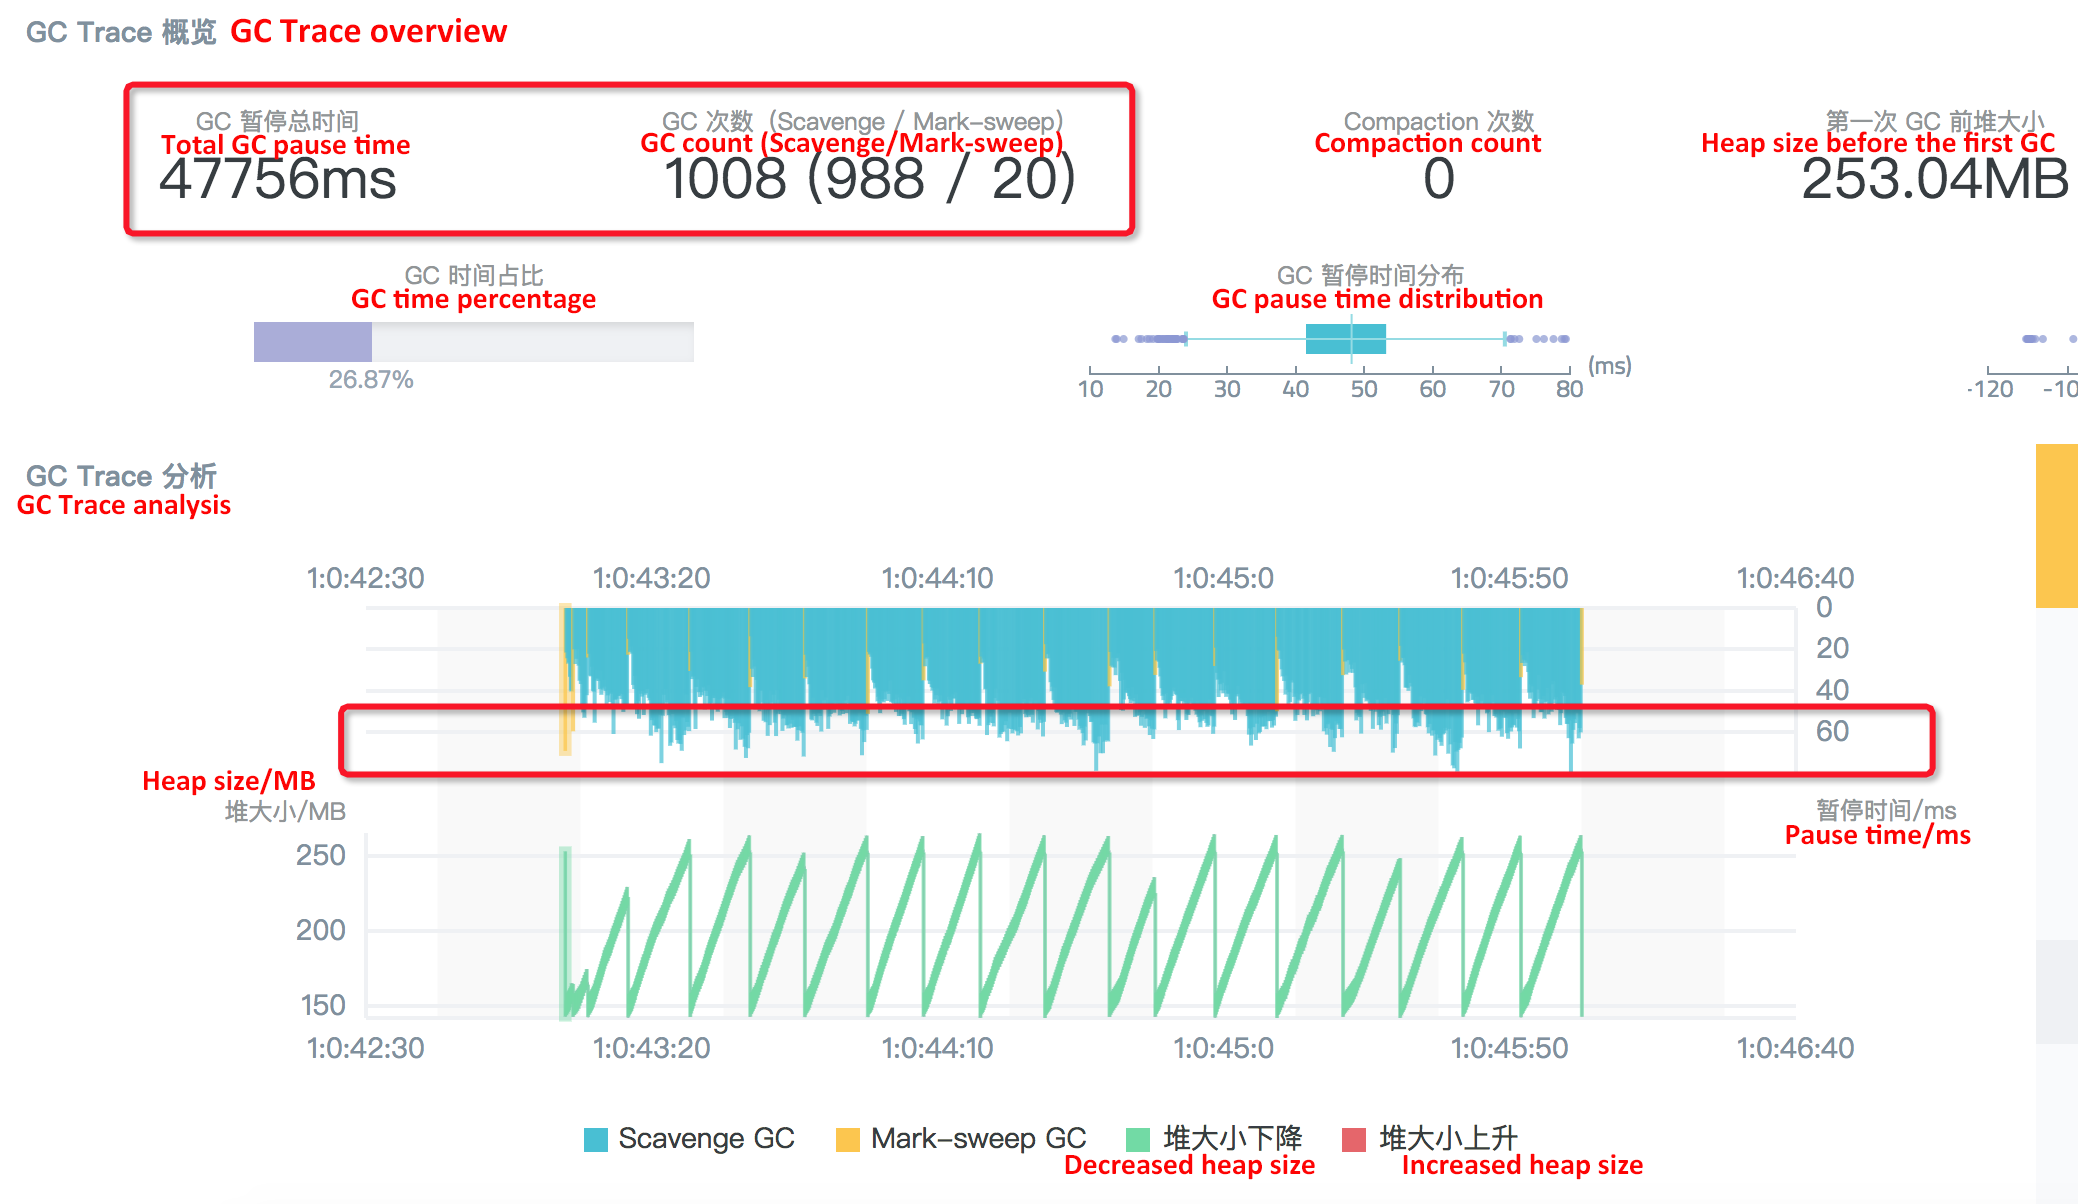
In the GC Trace analysis result graph, information included in the red rectangles is very important:
From the GC Trace analysis, we can see that the central part to GC optimization for this scenario relates to scavenge collection. From learning about the scavenge logic in V8, we know that the condition that triggers the collection in this phase is semi space allocation failed.
Therefore, we can speculate that a large number of small objects are frequently generated in the new generation during stress testing. They occupy the default semi space and triggering the flip of the state. That is why the user's application has so many scavenge collections and uses a high percentage of the CPU during GC tracing. In such case, the question reminds whether to optimize the system by adjusting the value of the default semi space.
After checking the V8 code, we can see that the default size of the semi space is 16 MB (alinode-v3.11.3/node-v8.11.3). After some discussion with the user, we plan to change the size to 64M, 128M and 256M, respectively, and then test if performance improves or not. We can apply this change by adding the --max_semi_space_size flag when starting the application on the node.
After the semi space is set to 64 MB, we can perform online stress testing and obtain the CPU Profile and GC Trace results during the stress test:
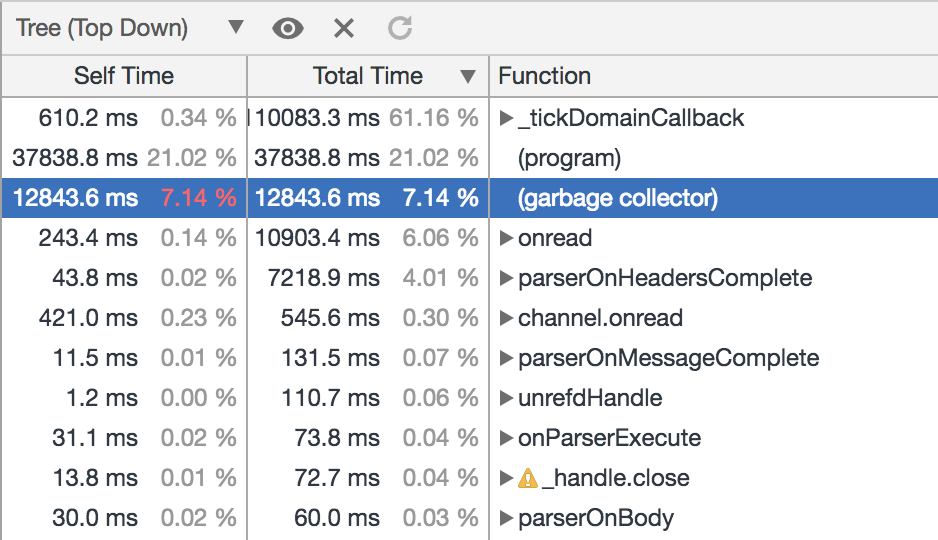
We can see that the CPU consumption rate of the garbage collector is reduced to around 7 percent. The following are the GC Trace results:
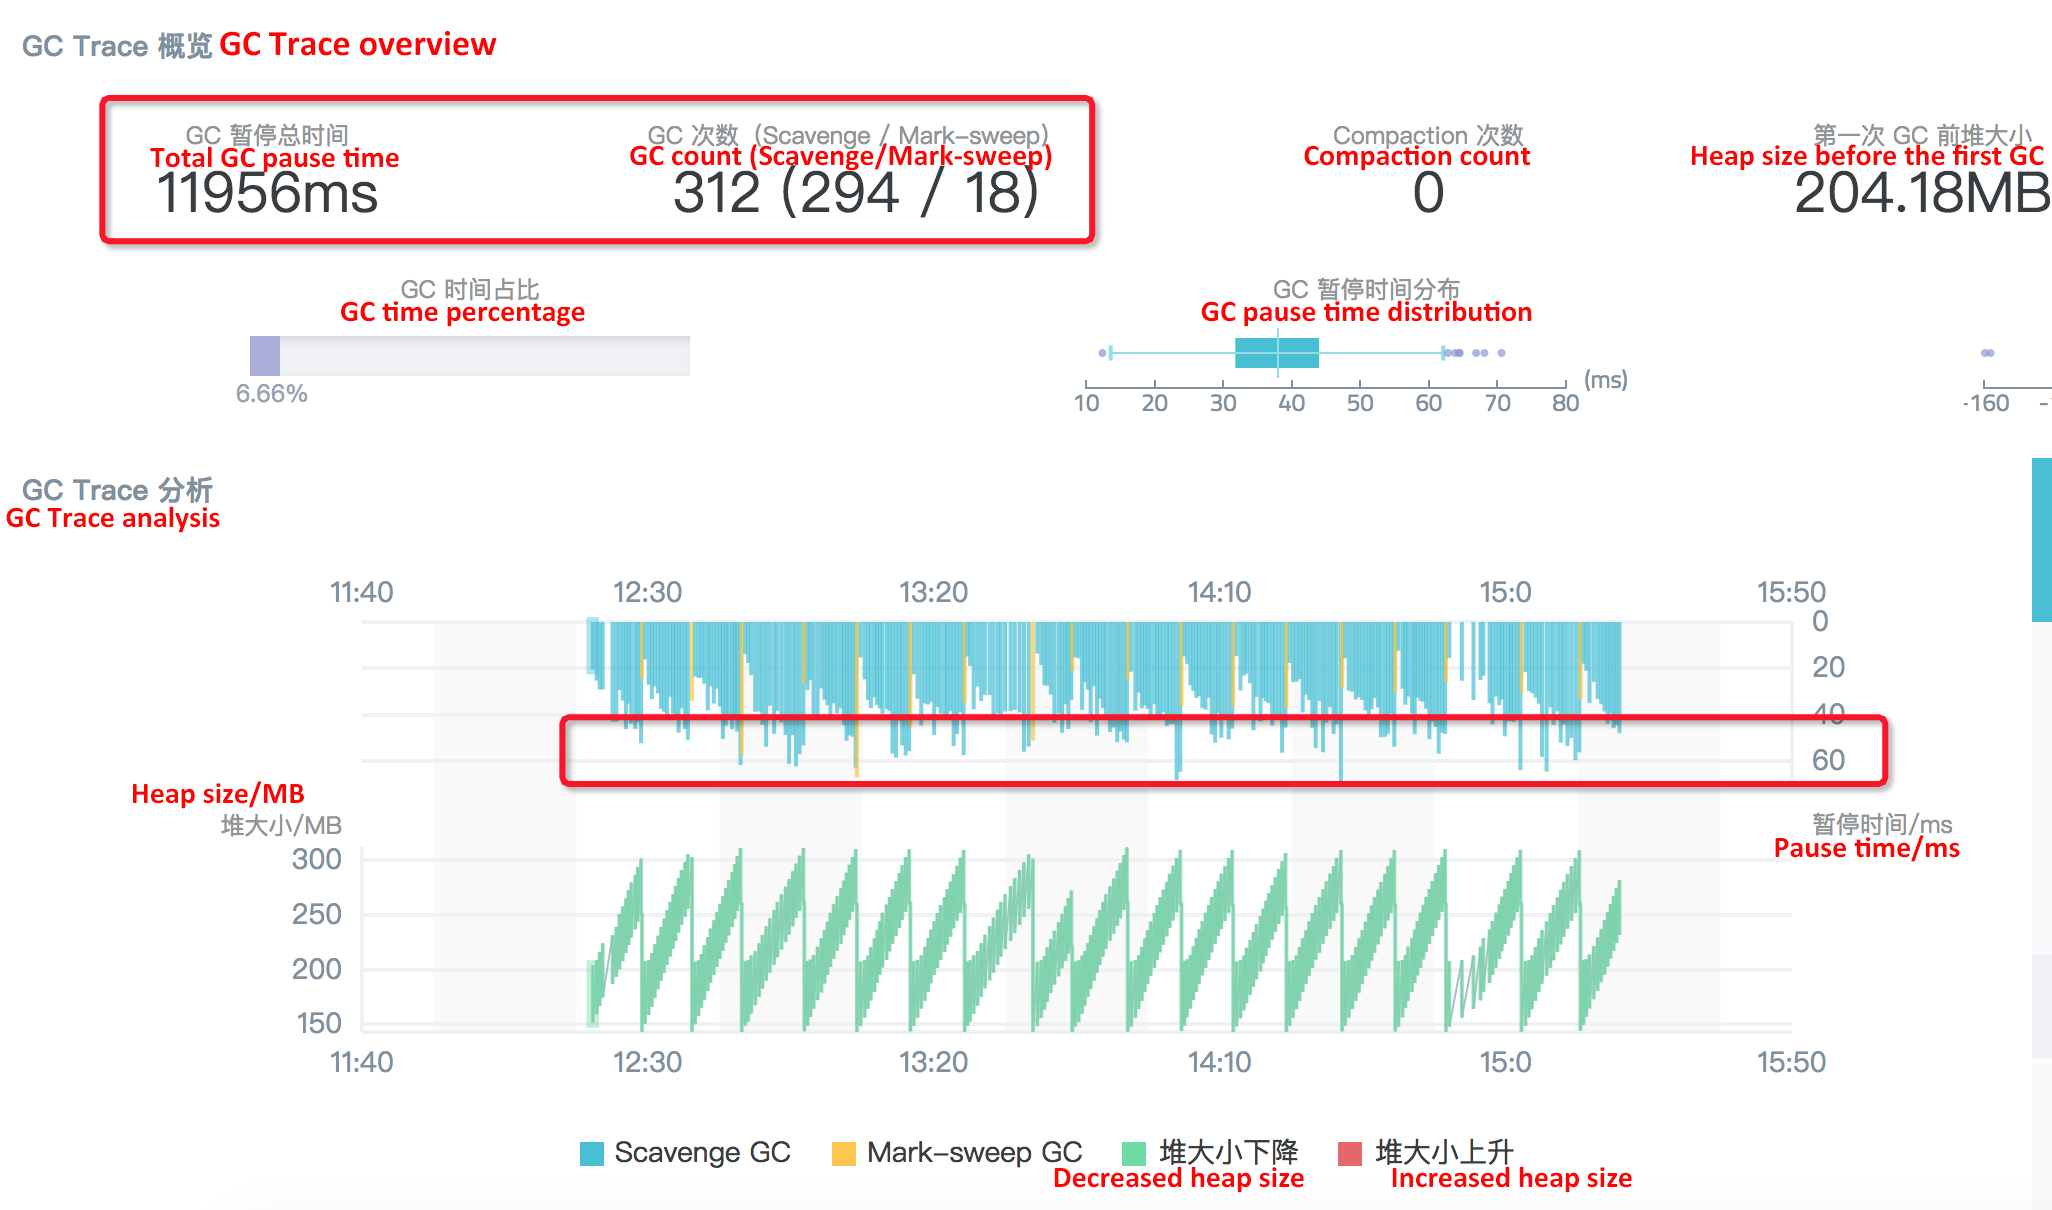
It is clear that the scavenge count is reduced from nearly 1000 to only 294 after the semi space size increased to 64 MB. In which case, the time needed for each collection is still fluctuating between 50 ms and 60 ms, without any obvious changes. Therefore, the total pause time during the three-minute GC is reduced from 48s to 12s. Accordingly, QPS is increased by around 10%.
Adjust the semi space size to 128 MB and see the CPU Profile results:
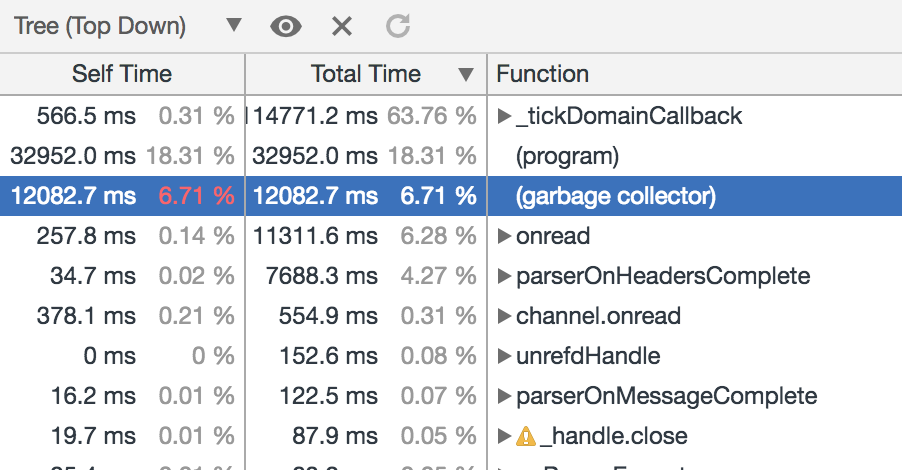
The CPU consumption rate of the garbage collector is slightly reduced when compared with that in the case of 64 MB semi space. The following are the GC Trace results:
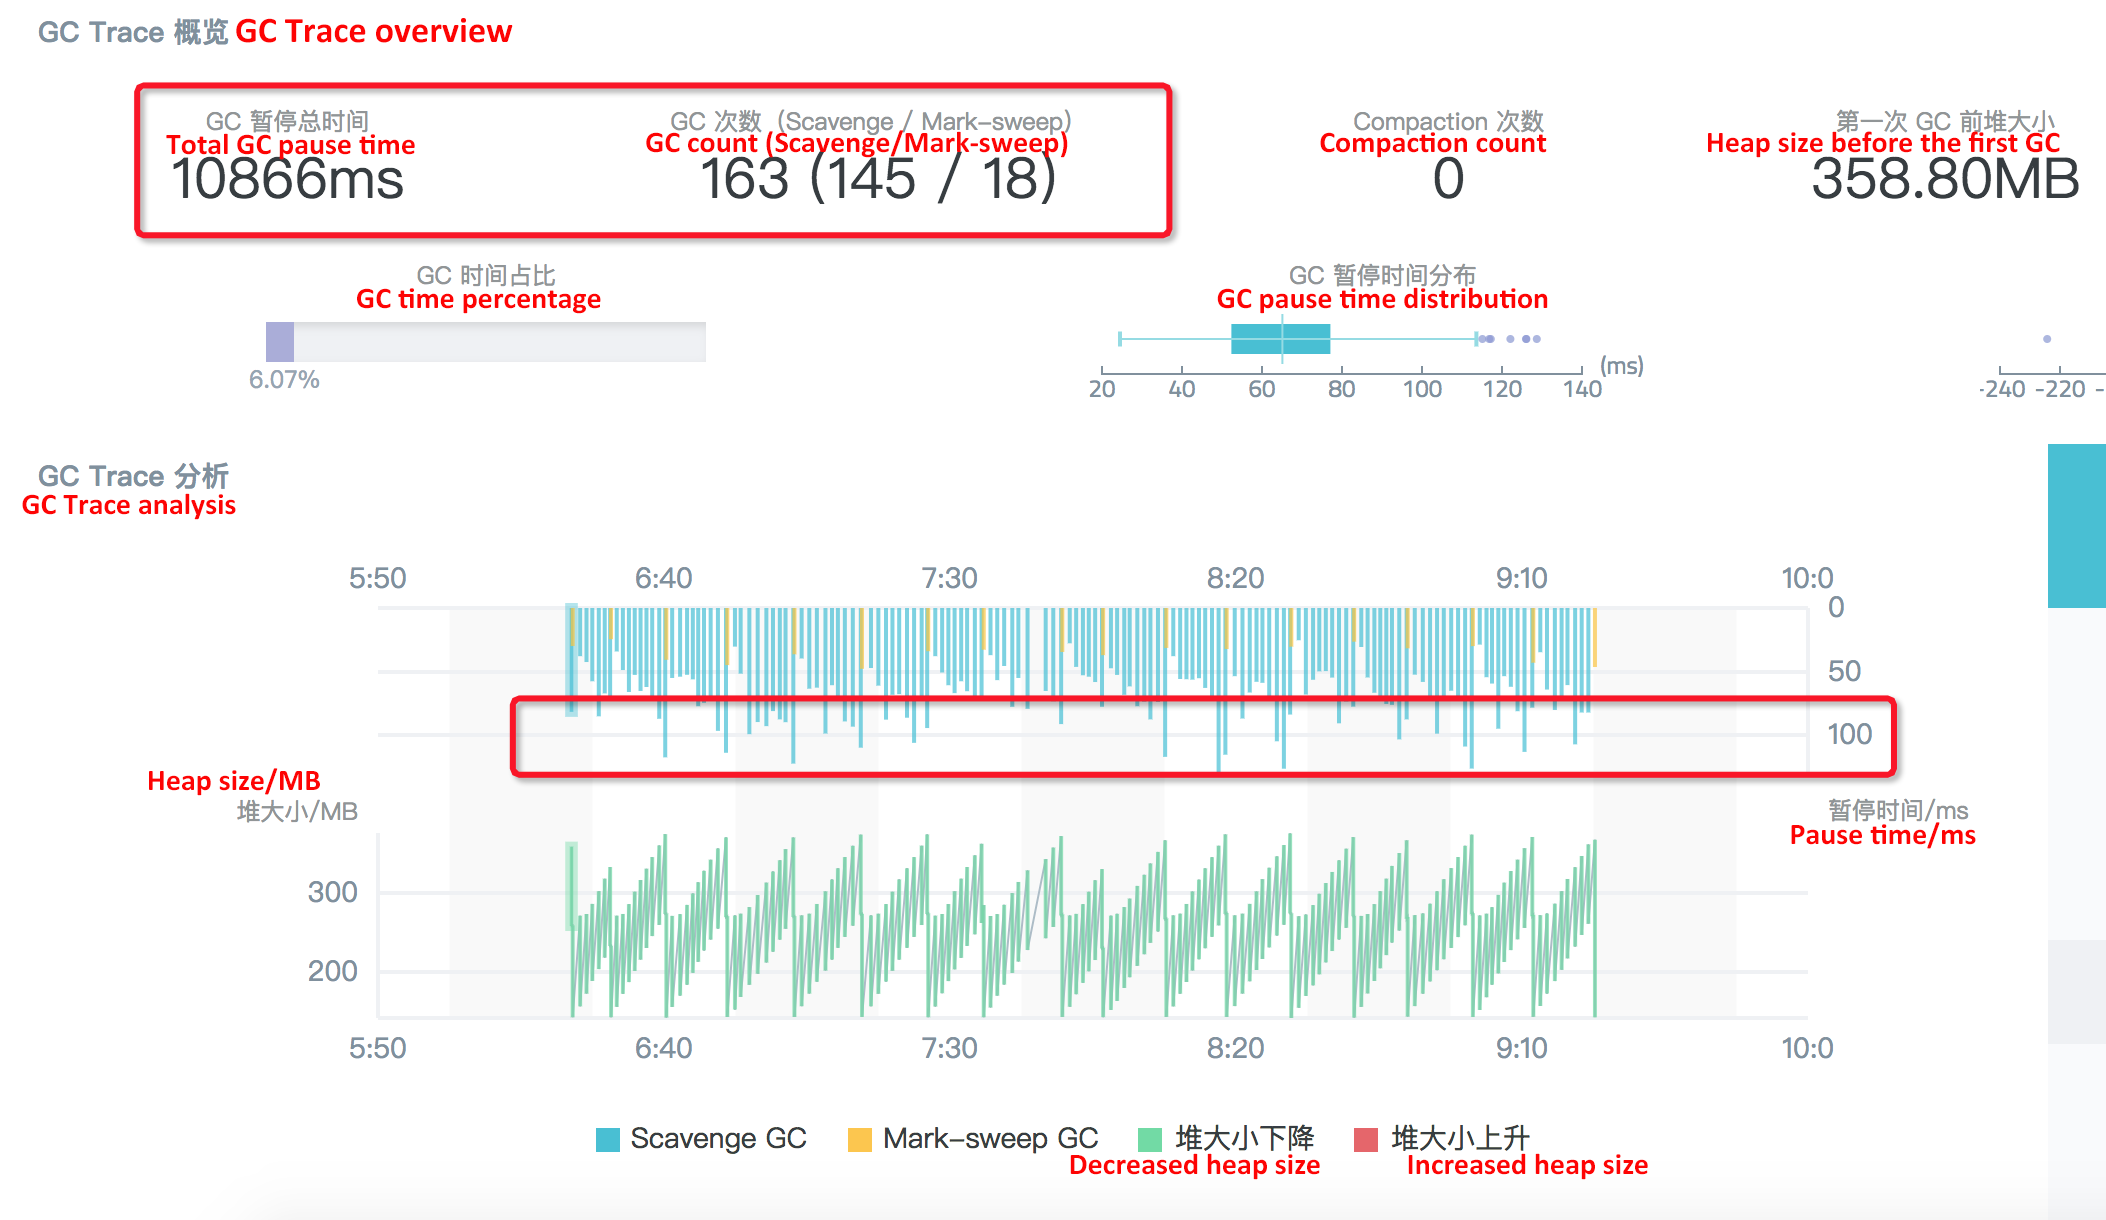
The ratio of the GC duration is not significantly reduced, compared with that when the size is set to 64 MB. The reason is: Although the semi space size is increased to 128 MB and the number of the scavenge collections is reduced from 294 to 145, the time need for each collection is almost doubled.
After the semi space size is set to 256 MB, the results are similar to those when the space is 128 MB. Compared with the 64 MB semi space, the number of the scavenge collections in three minutes is reduced from 294 to 72, but the time needed for each collection is around 150 ms. As shown in the following figure, there isn't a significant improvement to the overall performance.
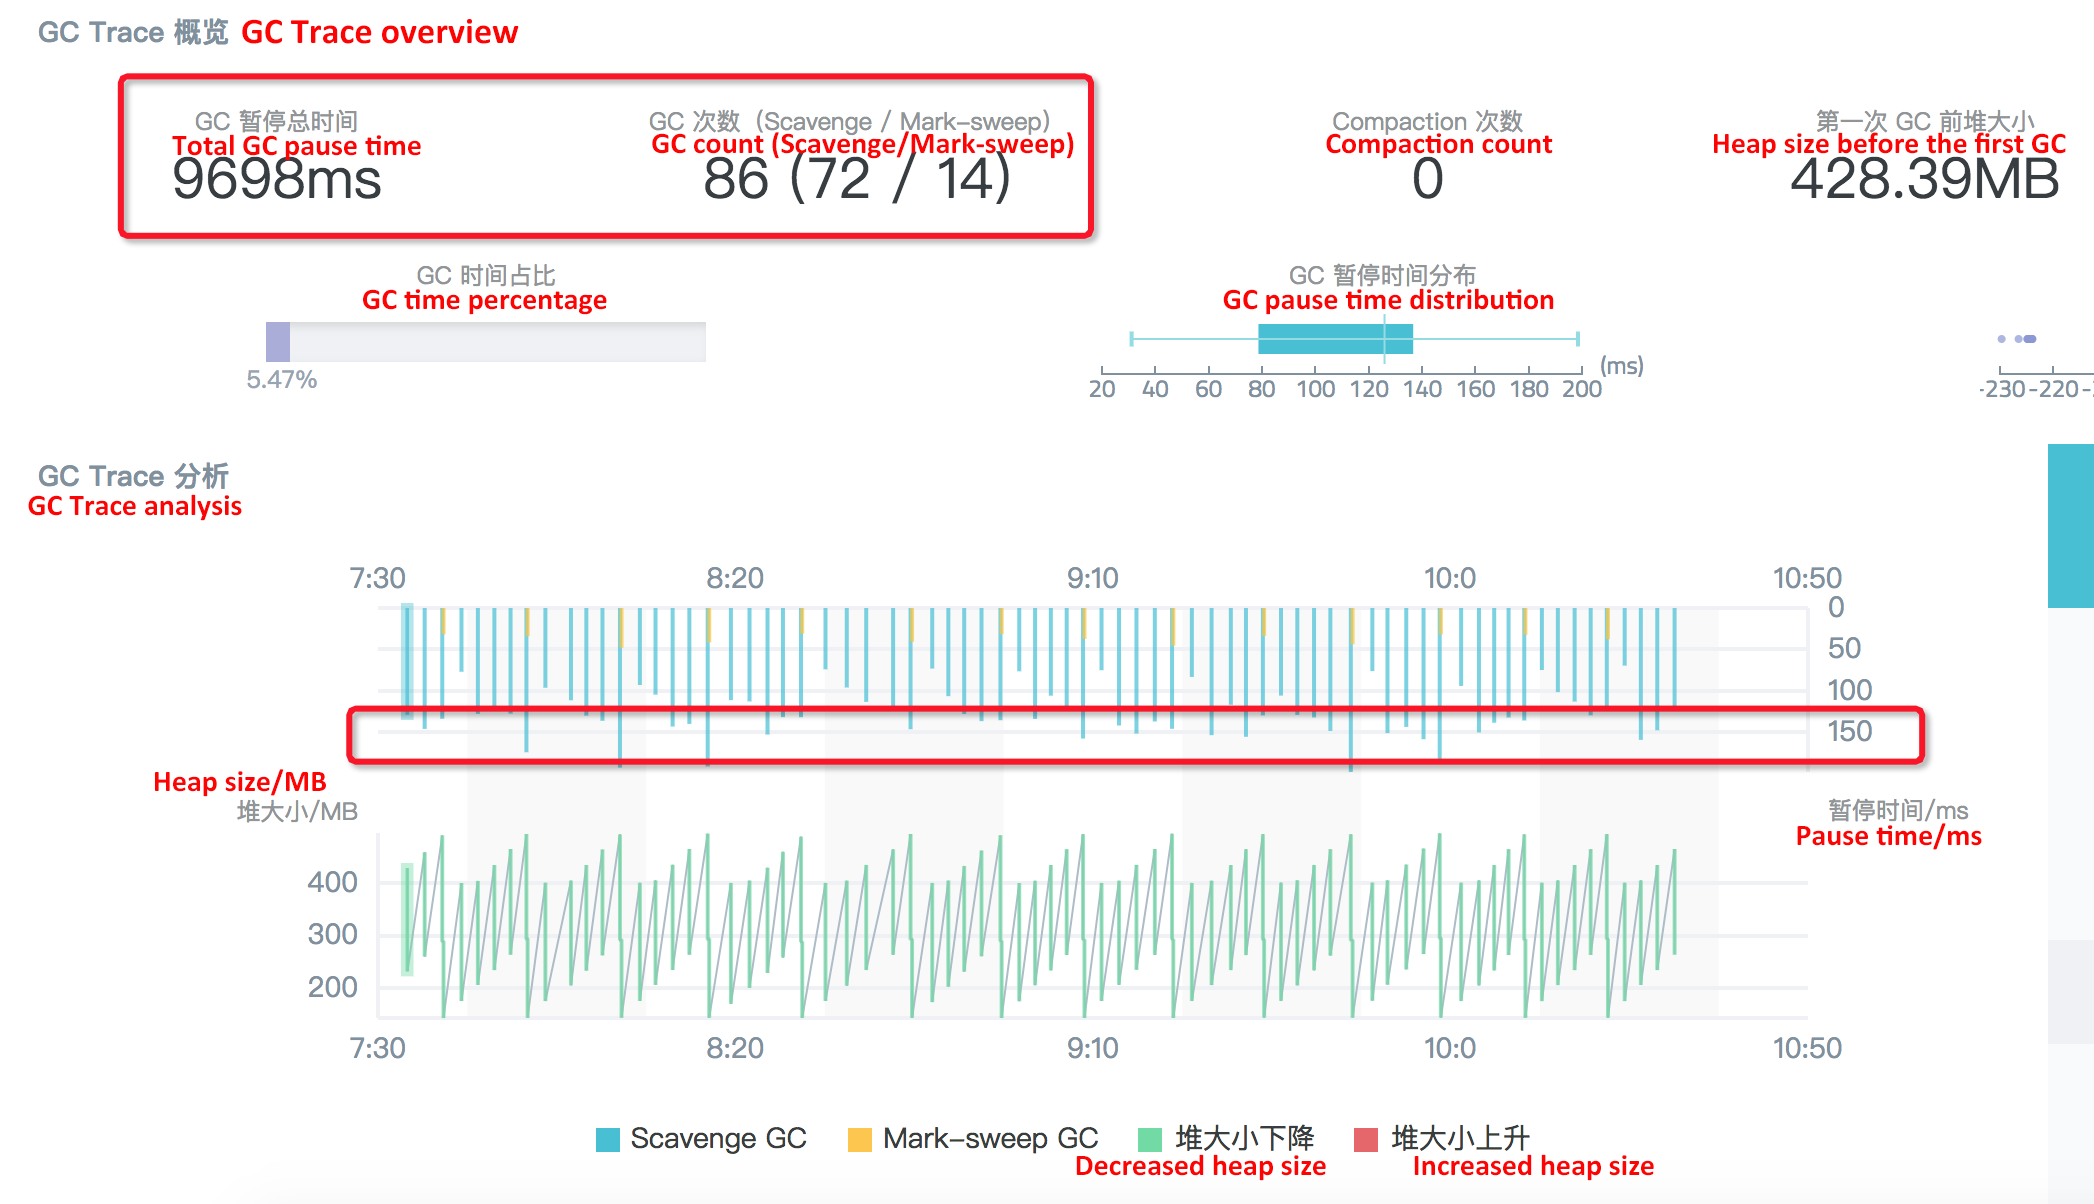
The previous tests show that the overall GC performance for the node application is significantly increased and the QPS during stress testing is increased by around 10 percent after the semi space size is changed from 16 MB (default value) to 64 MB. However, changing the semi space size to 128 MB or 256 MB does not bring obvious performance improvement. In addition, the semi space itself is memory allocated to objects in the young generation and cannot be too large. Therefore, the optimal semi space size for this project is 64 MB.
Runtime GC optimization is not a common means of improving project performance. The main reason for this is that runtime GC states are not directly exposed to developers. From this real customer case, however, we can see that real-time node application GC state monitoring and proper optimization though using Node.js Performance Platform is an easy way to improve project performance without modifying a single line of code.
New Feature to Node.js Performance Platform: Module Repository
hyj1991 - June 20, 2019
Alibaba Clouder - November 19, 2019
Alibaba Clouder - June 20, 2017
hyj1991 - June 20, 2019
Apache Flink Community China - December 25, 2020
Alibaba Clouder - April 15, 2021
 Web Hosting Solution
Explore Web Hosting solutions that can power your personal website or empower your online business.
Learn More YiDA Low-code Development Platform
A low-code development platform to make work easier
Learn More Web Hosting
Explore how our Web Hosting solutions help small and medium sized companies power their websites and online businesses.
Learn More mPaaS
mPaaS
Help enterprises build high-quality, stable mobile apps
Learn MoreMore Posts by hyj1991