By Musi
In the cloud-native era, Golang programming language has increasingly become the first choice for developers. For Golang developers, the most famous Golang web framework is undoubtedly the Gin[1] framework. As an officially recommended framework[2] of the Golang programming language, the Gin framework provides rich routing and middleware features, making Golang developers easy to build complex web applications. Given the importance of this web framework, how to quickly and comprehensively monitor Gin applications has emerged as a major challenge. This article will focus on introducing and comparing several official observability solutions recommended for the Gin framework, ultimately presenting best practices for Gin framework observability.
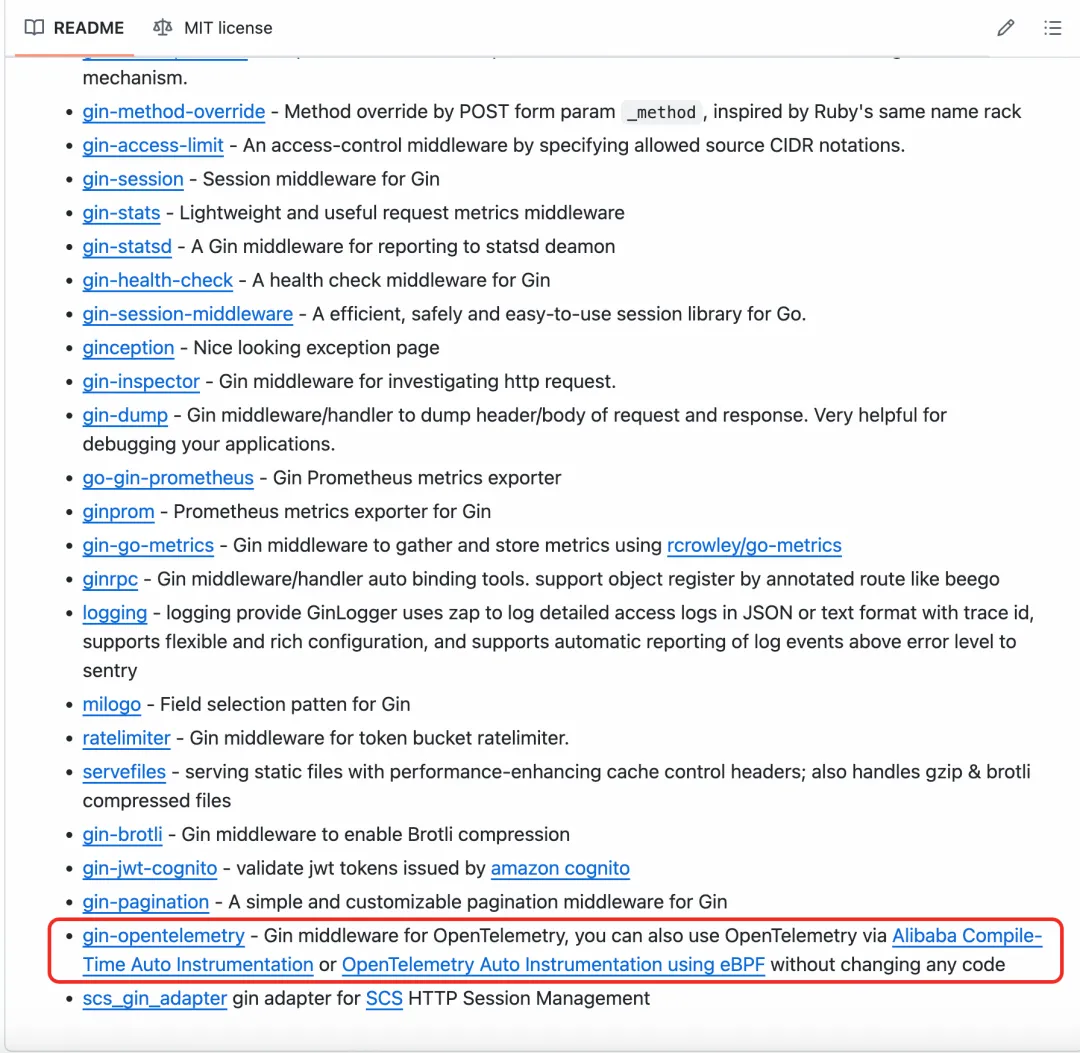
Gin provides various plug-ins to help developers quickly build web applications. In the official plug-in list[3], several support solutions for OpenTelemetry are provided, namely SDK manual instrumentation[4], compile-time injection[5], and eBPF[6]. The following sections will practically demonstrate each of these three officially recommended observability solutions.
1. First, create a simple Golang application using the Gin framework:
package main

import (
        "io"
        "log"
        "net/http"
        "time"

        "github.com/gin-gonic/gin"
)

func main() {
        r := gin.Default()
        r.GET("/hello-gin", func(c *gin.Context) {
                c.String(http.StatusOK, "hello\n")
        })
        go func() {
                _ = r.Run()
        }()

        // give time for auto-instrumentation to start up
        time.Sleep(5 * time.Second)
        for {
          resp, err := http.Get("http://localhost:8080/hello-gin")
          if err != nil {
                  log.Fatal(err)
          }
          body, err := io.ReadAll(resp.Body)
          if err != nil {
                  log.Fatal(err)
          }

          log.Printf("Body: %s\n", string(body))
          _ = resp.Body.Close()

          // give time for auto-instrumentation to report signal
          time.Sleep(5 * time.Second)
        }
}
2. Quickly start various server-side dependencies of OpenTelemetry (such as OpenTelemetry Collector, Jaeger, and Prometheus) according to the documentation[7].
The manual instrumentation approach uses the middleware mechanism of the Gin framework to generate a span for this request during request processing. We need to modify the existing code as follows:
const (
  SERVICE_NAME       = ""
  SERVICE_VERSION    = ""
  DEPLOY_ENVIRONMENT = ""
  HTTP_ENDPOINT      = ""
  HTTP_URL_PATH      = ""
)

// Set application resources.
func newResource(ctx context.Context) *resource.Resource {
  hostName, _ := os.Hostname()

  r, err := resource.New(
    ctx,
    resource.WithFromEnv(),
    resource.WithProcess(),
    resource.WithTelemetrySDK(),
    resource.WithHost(),
    resource.WithAttributes(
      semconv.ServiceNameKey.String(SERVICE_NAME), // The application name.
      semconv.ServiceVersionKey.String(SERVICE_VERSION), // The application version.
      semconv.DeploymentEnvironmentKey.String(DEPLOY_ENVIRONMENT), // The deployment environment.
      semconv.HostNameKey.String(hostName), // The hostname.
    ),
)

  if err != nil {
    log.Fatalf("%s: %v", "Failed to create OpenTelemetry resource", err)
  }
  return r
}

func newHTTPExporterAndSpanProcessor(ctx context.Context) (*otlptrace.Exporter, sdktrace.SpanProcessor) {

  traceExporter, err := otlptrace.New(ctx, otlptracehttp.NewClient(
    otlptracehttp.WithEndpoint(HTTP_ENDPOINT),
    otlptracehttp.WithURLPath(HTTP_URL_PATH),
    otlptracehttp.WithInsecure(),
    otlptracehttp.WithCompression(1)))

  if err != nil {
    log.Fatalf("%s: %v", "Failed to create the OpenTelemetry trace exporter", err)
  }

  batchSpanProcessor := sdktrace.NewBatchSpanProcessor(traceExporter)

  return traceExporter, batchSpanProcessor
}

// InitOpenTelemetry - the OpenTelemetry initialization method.
func InitOpenTelemetry() func() {
  ctx := context.Background()

  var traceExporter *otlptrace.Exporter
  var batchSpanProcessor sdktrace.SpanProcessor

  traceExporter, batchSpanProcessor = newHTTPExporterAndSpanProcessor(ctx)

  otelResource := newResource(ctx)

  traceProvider := sdktrace.NewTracerProvider(
    sdktrace.WithSampler(sdktrace.AlwaysSample()),
    sdktrace.WithResource(otelResource),
    sdktrace.WithSpanProcessor(batchSpanProcessor))

  otel.SetTracerProvider(traceProvider)
  otel.SetTextMapPropagator(propagation.NewCompositeTextMapPropagator(propagation.TraceContext{}, propagation.Baggage{}))

  return func() {
    cxt, cancel := context.WithTimeout(ctx, time.Second)
    defer cancel()
    if err := traceExporter.Shutdown(cxt); err != nil {
      otel.Handle(err)
    }
  }
}

func main() {
    r := gin.Default()
    // Initialize your OpenTelemetry.
    tp, err := InitOpenTelemetry()
  if err != nil {
    log.Fatal(err)
  }
  defer func() {
    if err := tp.Shutdown(context.Background()); err != nil {
      log.Printf("Error shutting down tracer provider: %v", err)
    }
  }()
    // Add the OpenTelemetry middleware implementation to GIN.
    r.Use(otelgin.Middleware("my-server"))
    r.GET("/hello-gin", func(c *gin.Context) {
        c.String(http.StatusOK, "hello\n")
    })
}
By adding OpenTelemetry middleware to the Gin service in the code, you can effectively collect the trace information of the Gin application itself:

It can be seen that the manual access solution requires significant code modifications, including manually introducing dependencies, initializing SDK, and manually injecting the middleware. In addition, this solution can only collect the trace information of the Gin application itself. For the upstream and downstream applications of Gin, the code needs to be transformed to connect and correlate the entire link.
In addition to the manual instrumentation approach, the official documentation also recommends a compile-time automatic injection solution to achieve observability with no code modification. Users can refer to the compile-time automatic instrumentation project[8] open-sourced by Alibaba Cloud to instrument the above example application:
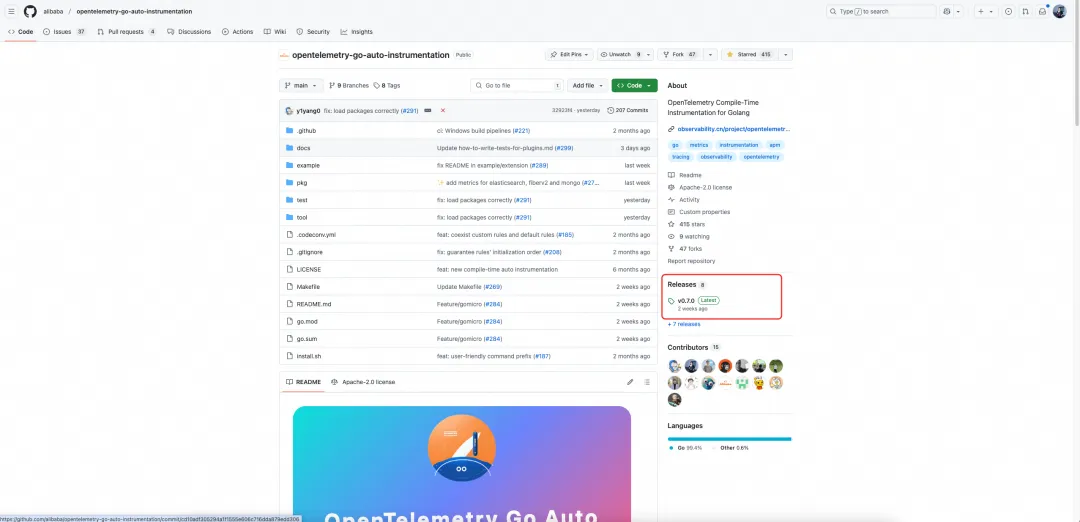
First, you can go to the homepage[9] to download the latest version of the Golang Agent binary package.
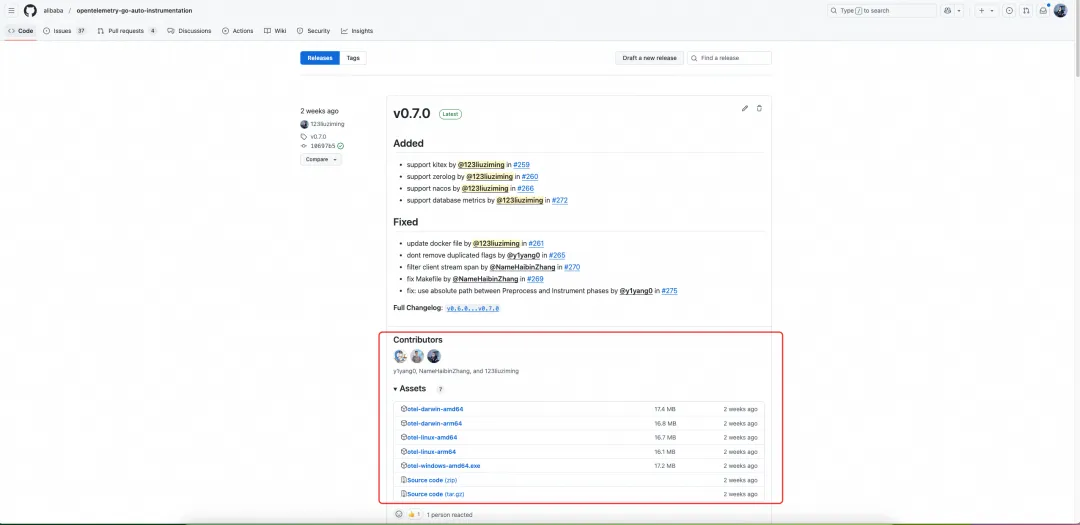
After obtaining the Golang Agent binary package, you can use it to compile the binary programs of Golang applications instead of using the go build command.
otel-linux-amd64 go build .After you run the preceding command, you can find a Golang binary program with observability in the root directory of the corresponding application.
Finally, configure the reporting endpoint of observability data by following the documentation[10] and start the Golang binary program with observability compiled in the previous step:

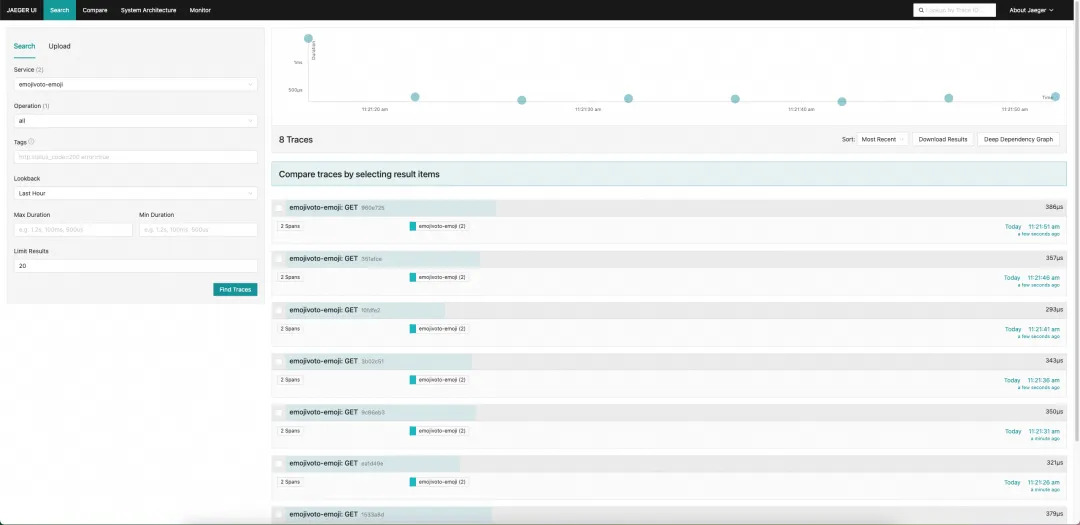
The compiled Golang binary program can completely display the trace of the application.
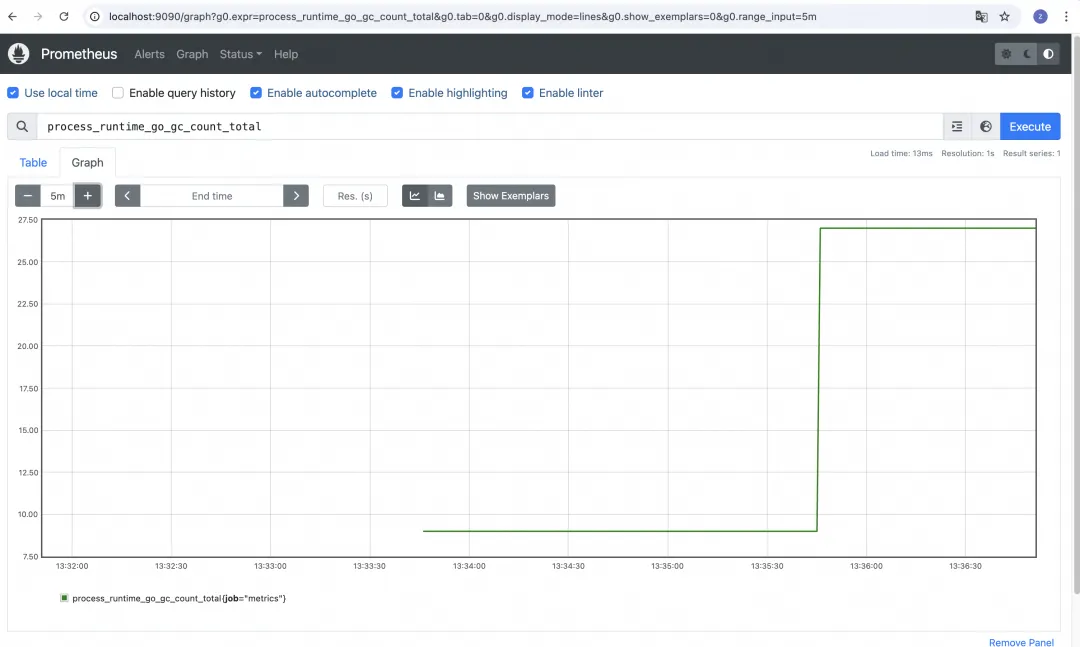
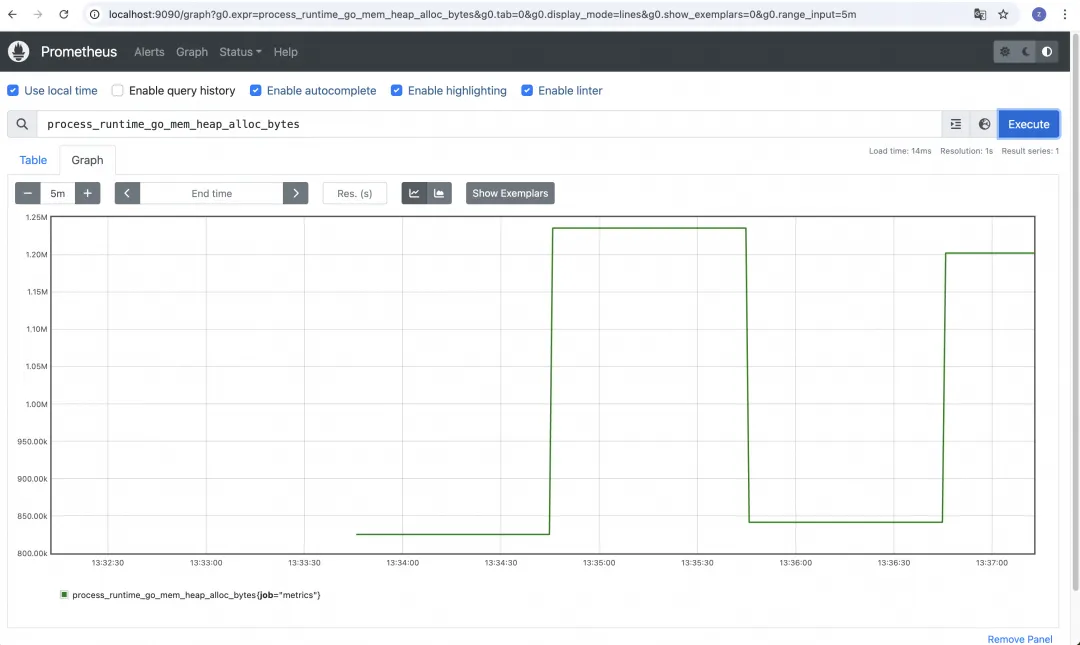
Beyond the trace, it also effectively collects runtime metrics of the Gin application, such as the call duration, the number of GC, and the number of memory requests.
The last official method for Gin application observability is to use the eBPF solution of OpenTelemetry for automatic instrumentation. In eBPF, you only need to deploy a privileged sidecar container within the namespace of the application process when you deploy the application. The privileged sidecar container automatically captures and reports observability data generated by the application container.
Let's observe the simple Golang application used in Step 1 and deploy the following YAML template in the Kubernetes environment:
apiVersion: apps/v1
kind: Deployment
metadata:
  labels:
    app.kubernetes.io/name: emoji
    app.kubernetes.io/part-of: emojivoto
    app.kubernetes.io/version: v11
  name: emoji
  namespace: emojivoto
spec:
  progressDeadlineSeconds: 600
  replicas: 1
  revisionHistoryLimit: 10
  selector:
    matchLabels:
      app: emoji-svc
      version: v11
  template:
    metadata:
      labels:
        app: emoji-svc
        version: v11
    spec:
      containers:
        - env:
            - name: HTTP
              value: '8080'
          image: 'registry.cn-hangzhou.aliyuncs.com/private-mesh/ginotel:latest'
          imagePullPolicy: Always
          name: emoji-svc
          ports:
            - containerPort: 8080
              name: grpc
              protocol: TCP
          resources:
            requests:
              cpu: 100m
          terminationMessagePath: /dev/termination-log
          terminationMessagePolicy: File
        - env:
            - name: OTEL_GO_AUTO_TARGET_EXE
              value: /usr/local/bin/app
            - name: OTEL_EXPORTER_OTLP_ENDPOINT
              value: 'http://jaeger.default.svc:4318'
            - name: OTEL_SERVICE_NAME
              value: emojivoto-emoji
          image: >-
            ghcr.io/open-telemetry/opentelemetry-go-instrumentation/autoinstrumentation-go:v0.19.0-alpha
          imagePullPolicy: IfNotPresent
          name: emojivoto-emoji-instrumentation
          resources: {}
          securityContext:
            privileged: true
            runAsUser: 0
          terminationMessagePath: /dev/termination-log
          terminationMessagePolicy: File
      dnsPolicy: ClusterFirst
      restartPolicy: Always
      schedulerName: default-scheduler
      securityContext: {}
      shareProcessNamespace: true
      terminationGracePeriodSeconds: 0
The observability data generated by the Gin application is automatically collected and reported to Jaeger:


The eBPF solution may appear ideal in theory, but it has various limitations in actual use. For example, it is highly sensitive to minor versions of Golang. If the demo application is compiled with Go 1.23.4 (one minor version upgrade), eBPF will fail to collect any observability data due to Golang version incompatibility,

In addition, the eBPF solution has many other limitations. For example, the number of HTTP headers transmitted by the client cannot exceed 8. eBPF has high requirements on the kernel version of the operating system. For details, see Non-intrusive Code Injection for Go Applications.
| Manual Instrumentation | Compile-time Automatic Instrumentation | eBPF Automatic Instrumentation | |
|---|---|---|---|
| Access Cost | High, requiring extensive manual code changes. | Medium, requiring recompilation but no code changes. | Low, neither code changes nor recompilation needed. |
| Compatibility | Excellent, with fewer restrictions. | Excellent, with fewer restrictions. | Poor, with more restrictions. |
| Observability Coverage | Poor. You can only observe the Gin application hop. | Excellent. You can easily observe the upstream and downstream, and even application runtime metrics. | Medium. You can easily observe the upstream and downstream, but cannot monitor application runtime metrics. |
| Security | Excellent | Excellent | Poor, requiring privileged containers. |
| Performance | High | High | Low. eBPF uProbe introduces substantial performance impact. |
| Maintenance Costs | High, requiring manually updating dependencies. | Low, no manual dependency updates required. | Low, no manual dependency updates required. |
In general, manual instrumentation offers higher flexibility but incurs the greatest access and maintenance costs, which is suitable for users with strong technical capabilities to fully control by themselves. The eBPF automatic instrumentation solution has the lowest access cost but comes with performance overheads and various limitations in usage scenarios. In contrast, the compile-time automatic instrumentation solution relatively addresses the shortcomings of the first two solutions, reducing user access and maintenance costs and solving instrumentation performance and security concerns. To some extent, it currently represents the optimal observability solution for the Gin application!
Golang Agent successfully solves cumbersome manual instrumentation issues in Golang application monitoring and has been commercialized on Alibaba Cloud, providing customers with powerful monitoring capabilities. This technology was originally designed to allow users to insert monitoring code easily without changing the existing code, enabling real-time monitoring and analysis of application performance. However, its application areas have exceeded expectations, including service governance, code auditing, application security, and code debugging. It has also shown potential in many unexplored fields.
We have made this innovative solution open-source and donated it to the OpenTelemetry community[11]. The open-sourcing of the solution not only promotes technical sharing and improvement but also helps us continuously explore its potential in more fields with the help of the community.
[1] Gin
https://github.com/gin-gonic/gin
[2] Recommended framework
https://go.dev/doc/tutorial/web-service-gin
[3] Plug-in list
https://github.com/gin-gonic/contrib
[4] SDK manual instrumentation
https://github.com/open-telemetry/opentelemetry-go-contrib/tree/main/instrumentation/github.com/gin-gonic/gin/otelgin
[5] Compile-time injection
https://github.com/alibaba/opentelemetry-go-auto-instrumentation
[6] eBPF solution
https://github.com/open-telemetry/opentelemetry-go-instrumentation
[7] Documentation
https://opentelemetry.io/docs/demo/kubernetes-deployment/
[8] Compile-time automatic instrumentation project
https://github.com/alibaba/opentelemetry-go-auto-instrumentation
[9] Homepage
https://github.com/alibaba/opentelemetry-go-auto-instrumentation
[10] Documentation
https://opentelemetry.io/docs/specs/otel/configuration/sdk-environment-variables/
[11] OpenTelemetry community
https://github.com/open-telemetry/opentelemetry-go-compile-instrumentation
How We Built an Observability Agent 10x Faster Than Open Source Alternatives

706 posts | 57 followers
FollowAlibaba Cloud Native Community - August 19, 2025
Alibaba Cloud Native Community - November 18, 2024
Alibaba Cloud Native Community - October 15, 2024
Alibaba Cloud Native Community - April 15, 2026
Alibaba Cloud Native Community - April 9, 2026
Alibaba Cloud Native Community - November 27, 2025

706 posts | 57 followers
Follow Best Practices
Follow our step-by-step best practices guides to build your own business case.
Learn More Cloud-Native Applications Management Solution
Accelerate and secure the development, deployment, and management of containerized applications cost-effectively.
Learn More CloudMonitor
Automate performance monitoring of all your web resources and applications in real-time
Learn More Lindorm
Lindorm is an elastic cloud-native database service that supports multiple data models. It is capable of processing various types of data and is compatible with multiple database engine, such as Apache HBase®, Apache Cassandra®, and OpenTSDB.
Learn MoreMore Posts by Alibaba Cloud Native Community