By Zhang Huarui, Product Manager of DataWorks
This article is part of the series of One-stop Big Data Development and Governance DataWorks Use Collection.
DataWorks Operation Center is a module for testing and monitoring tasks. Users develop and debug code in DataStudio. After the debugging tasks are submitted and released, the tasks can run regularly according to the scheduling configuration. Then, the task enters the production environment from the development environment.
The testing, O&M, and monitoring of tasks in the production environment are all completed in the O&M center. The operation and maintenance center includes three parts: operation and maintenance screen, task operation and maintenance, and Intelligent Monitor. According to the trigger mode of task operation and maintenance, it can be divided into real-time task operation and maintenance, periodic task operation and maintenance, and manual task operation and maintenance.
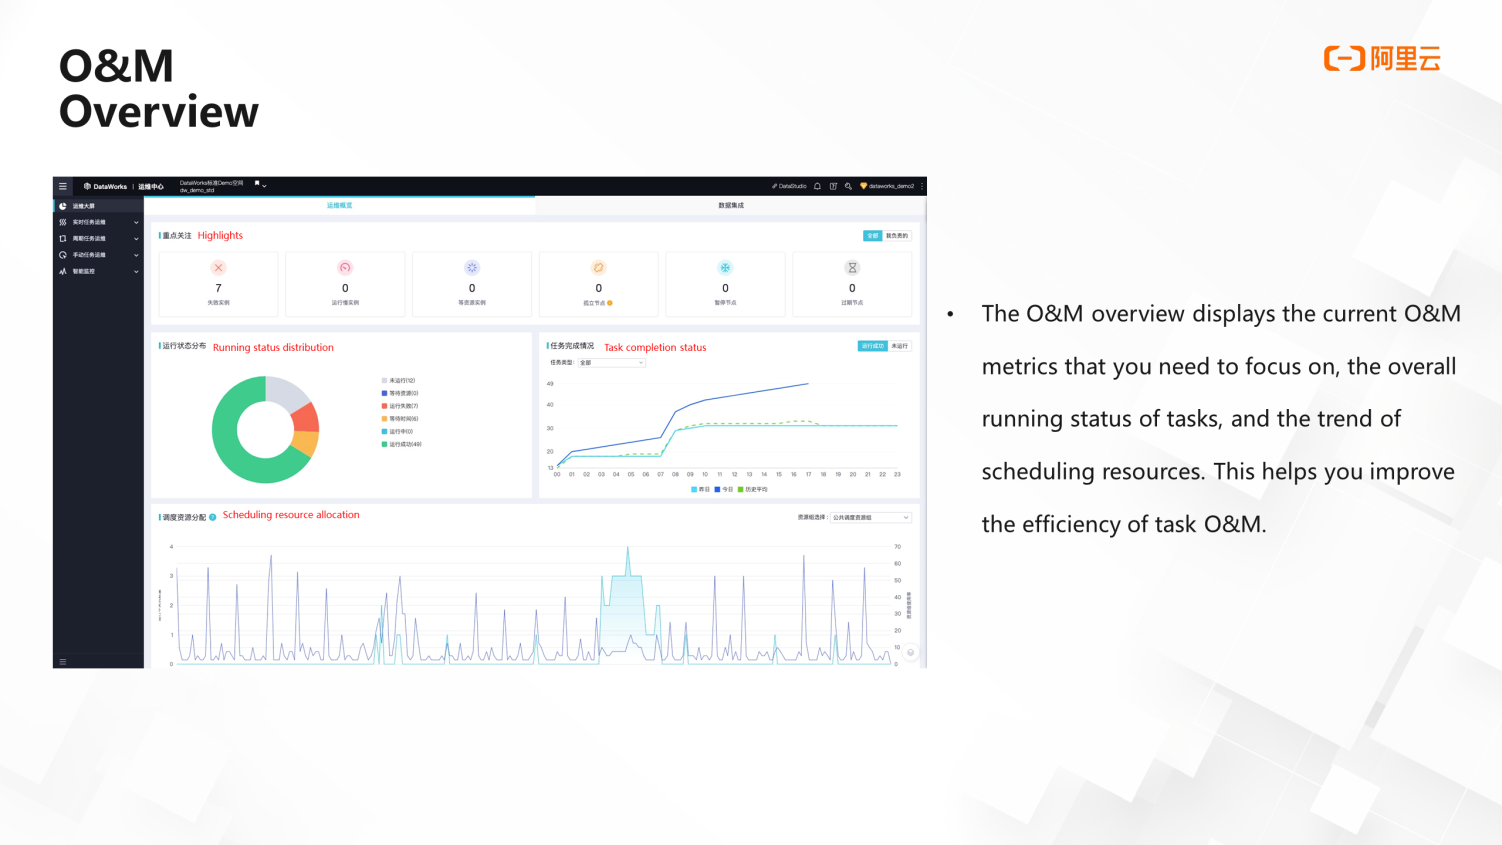
The O&M overview displays the current O&M metrics that need focus, including failed instances, slow-running instances, other resource instances, isolated nodes, paused nodes, and expired nodes. You can click the corresponding indicator on the big screen for additional operations.
The following figure shows the distribution of instance running status, including successful, failed, or other resources. There is a line chart of task completion on the right. The graph at the bottom shows the change trend of scheduling resources. Users can dynamically adjust the task uptime according to their task conditions in each time period to achieve the purpose of rational use of resources.
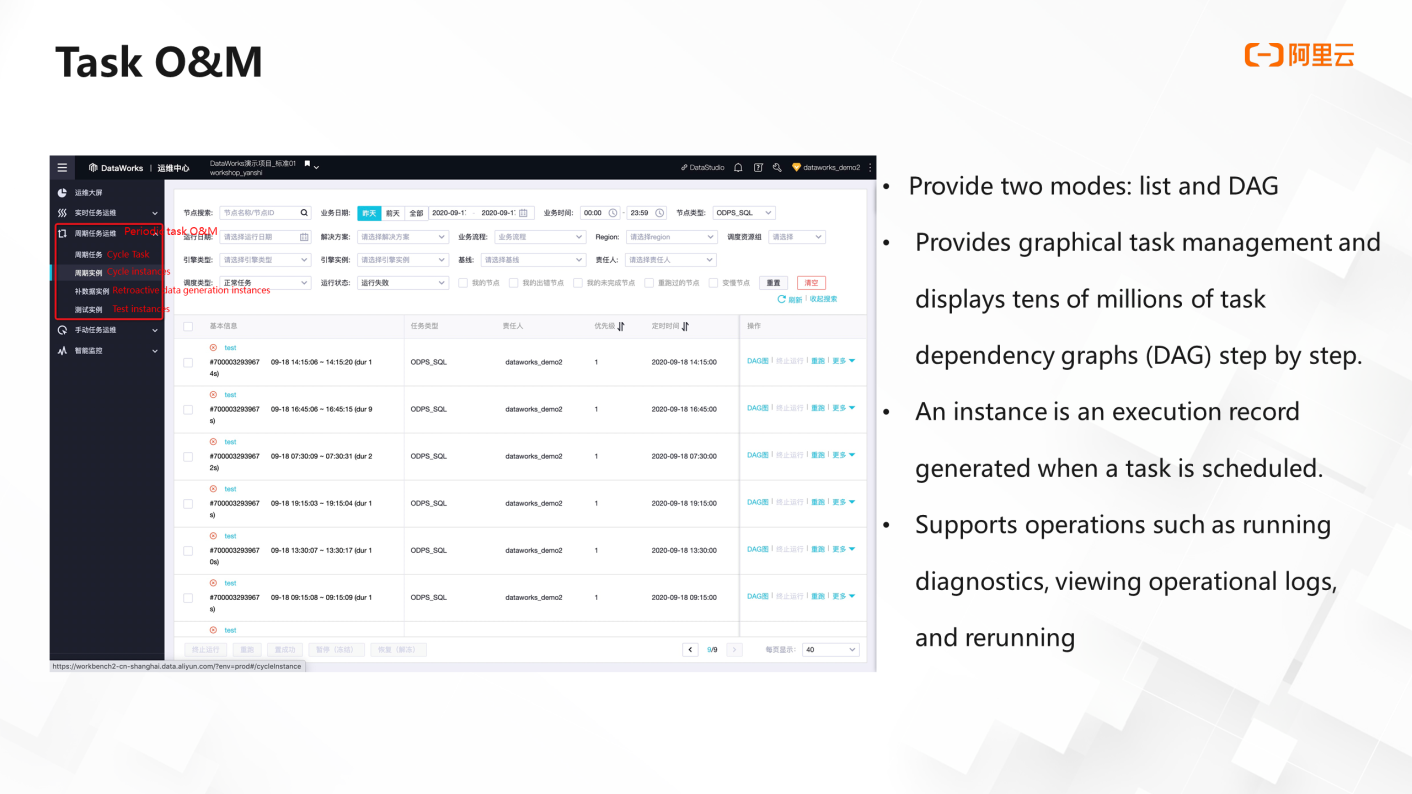
Operation Center provides two O&M modes: List and DAG. In the list mode, the filter area is located at the top, and the task list is located at the bottom. Users can easily perform batch operations.
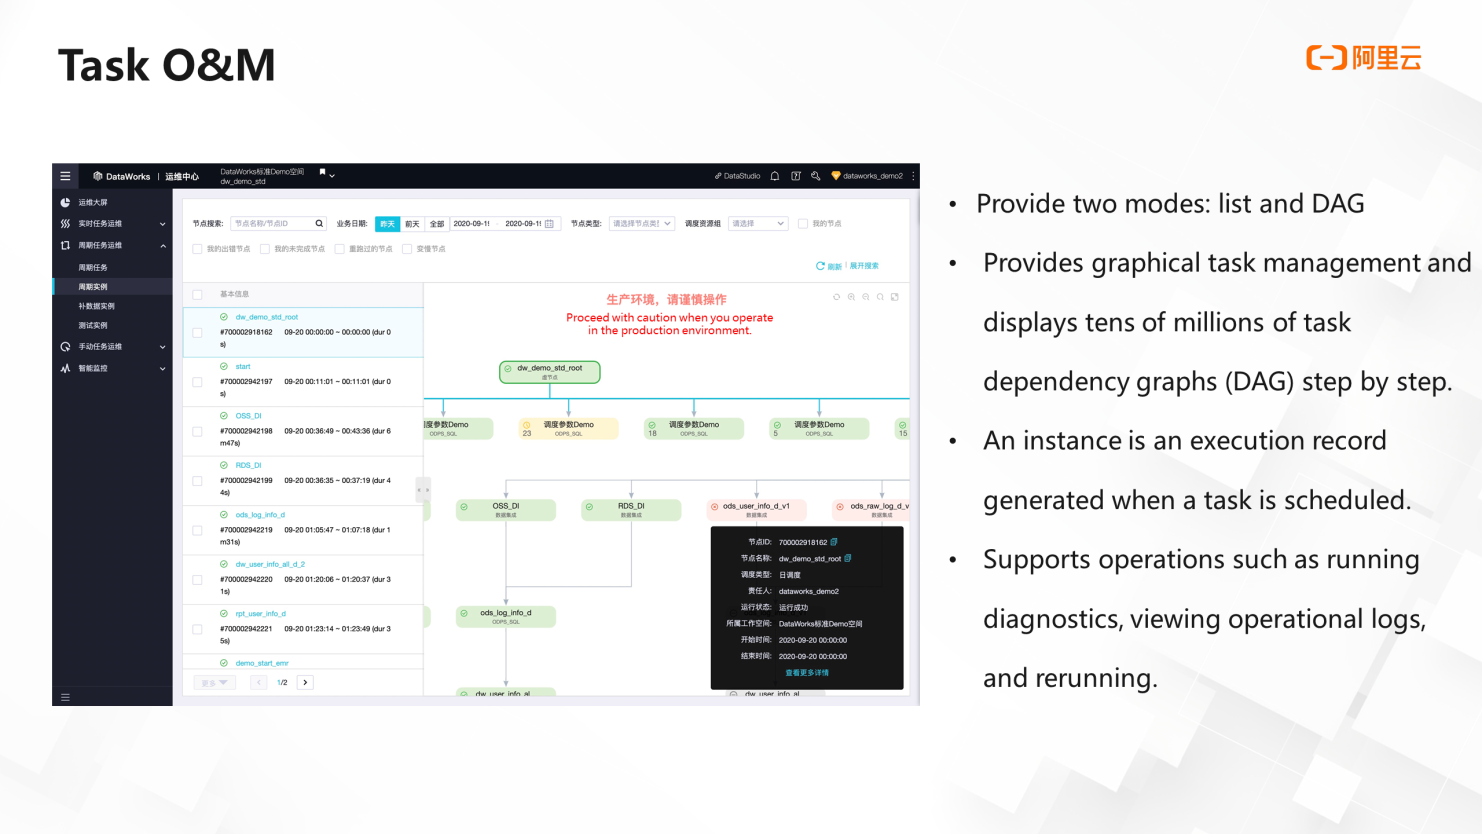
In DAG mode, users can see the operation of a single node and expand the upstream and downstream.
The operation sees the running status of the upstream and downstream nodes, which is convenient for users to troubleshoot errors. DAG provides graphical task management. Tens of millions of task dependency graphs can be displayed step by step.
Instances are a very important concept in Operation Center. As mentioned above, the task enters the production environment from the development environment by submitting the release operation. The instance is the execution record generated when the task is scheduled in the production environment.
Operation Center supports operations, such as running diagnosis, viewing running logs, and rerunning. The following is a brief introduction.
If a user submits and publishes a task on September 20, the task will run regularly from the same day at the earliest, and data will also be produced from this day. What should users do if they want to get the data before September 20? This uses the complement feature.
In the Periodic Tasks menu, you will see the tween option in list mode or right-click a node in DAG mode to find the tween option. Then, select the range of nodes for retroactive data generation, whether to only generate data for the current node, generate data for the current node and downstream, or generate data for a large number of nodes. In the massive node mode, you can select multiple nodes under multiple workspaces to generate retroactive data.
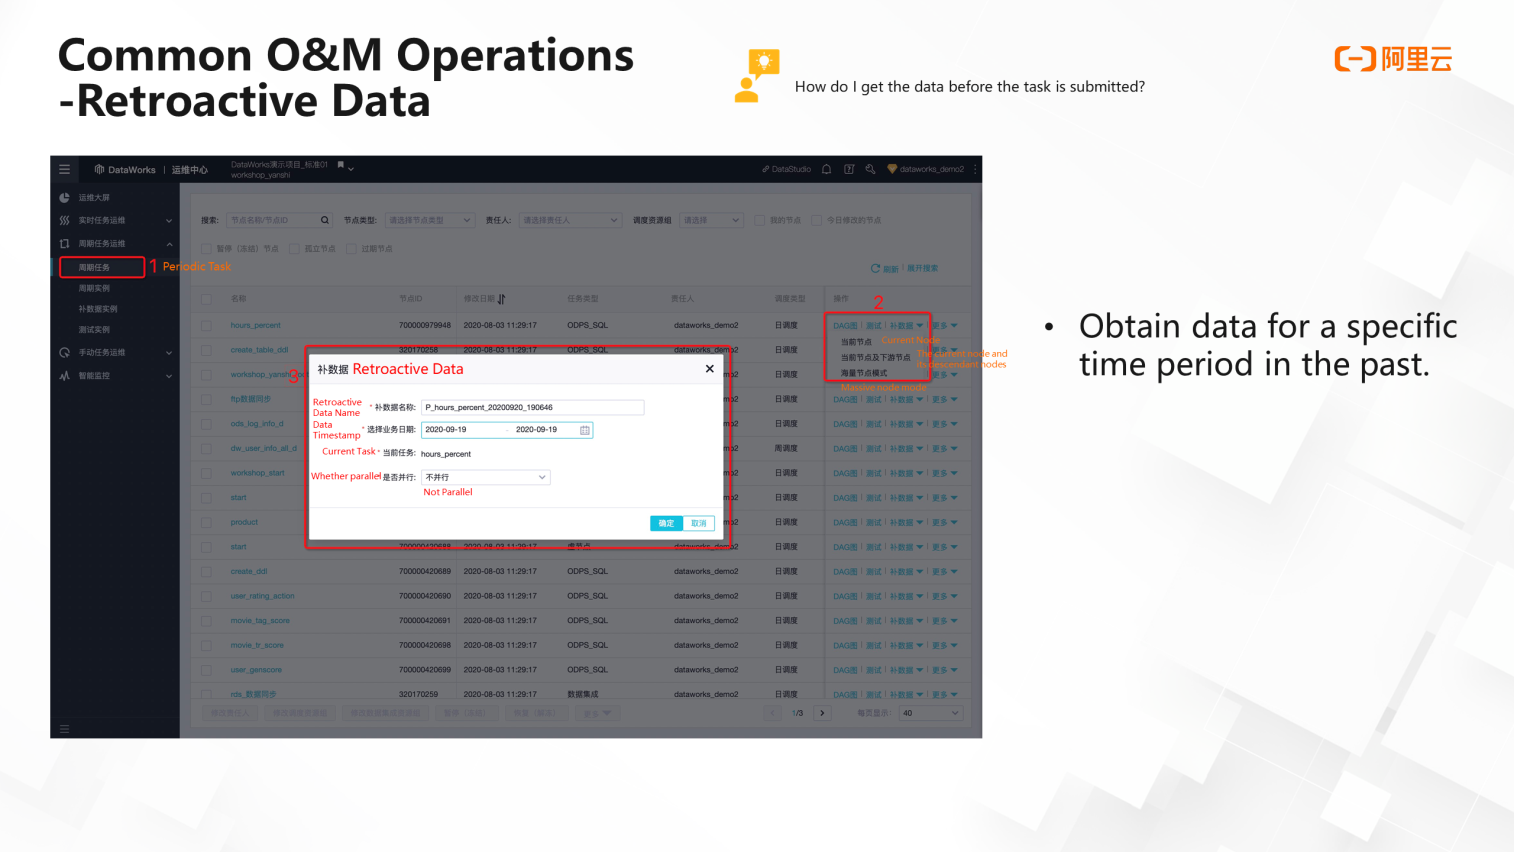
If you want to complete the September data, you can set the range from September 1 to 19. When the range of retroactive data is relatively large, or the number of nodes is relatively large, you can set parallel, which can improve the speed of retroactive data.
Therefore, the data supplement function can help users obtain data for a specific time period in the past.
The ideal state for a task to run at a scheduled time is that it runs without errors, and the time when the task is produced is guaranteed. However, there are always some problems in the running of the task. The task does not run when the scheduled time comes, or the task suddenly runs slowly or goes wrong. At this time, the operation diagnosis function of the operation and maintenance center can be used.
You can click the Task Running Status icon to initiate diagnosis. You can also right-click a task in the DAG and select Run Diagnosis.
Task diagnosis includes four parts: upstream dependency, scheduled check, scheduling resources, and task execution.
First, the running diagnosis shows the running status of the upstream node, which allows users to quickly locate which node is blocked because the prerequisite for task running is that the upstream nodes are running successfully. Then, it will do a timing check to check whether the task timing has arrived. The scheduling resource section shows the water level (usage) of the resource group. The polyline section in the following figure shows the water level change trend. The yellow color block indicates that the task is waiting for resources, and the green color block indicates that the task is running. At the same time, you can view the running status of instances of the same task 15 times in the history navigation bar.
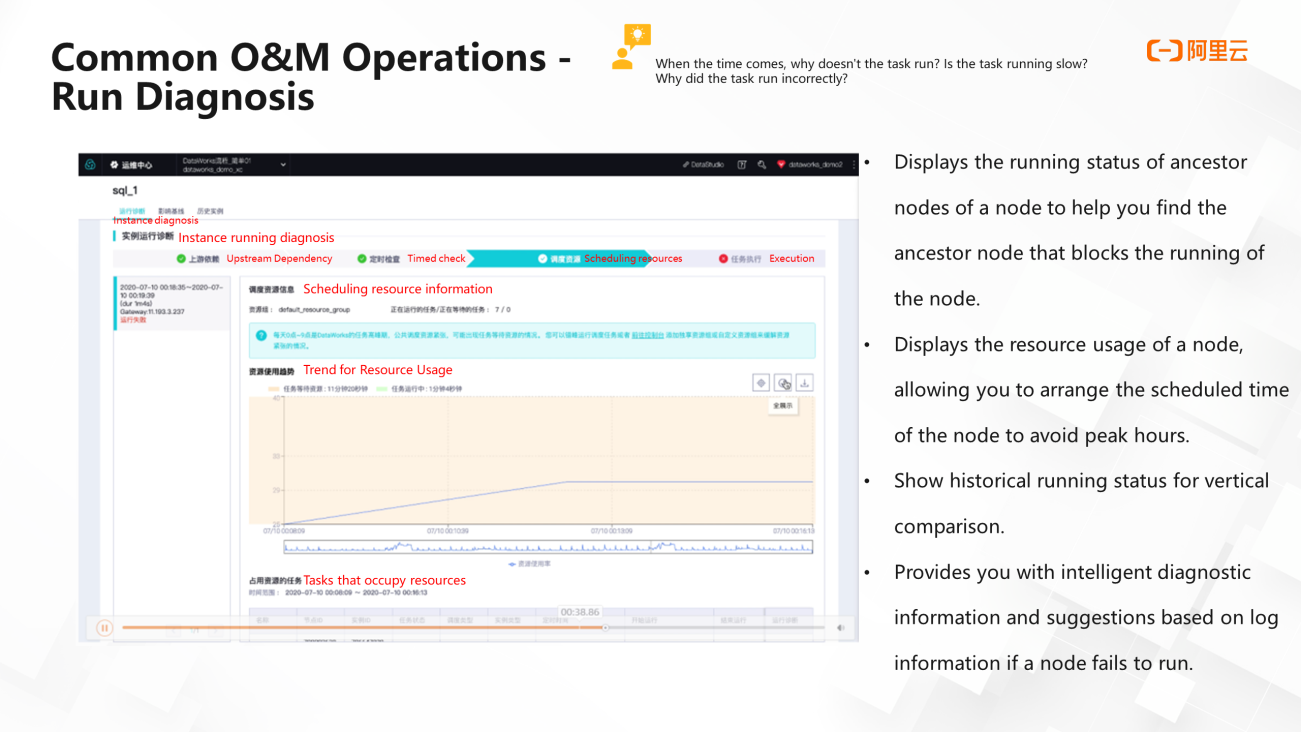
Finally, MaxCompute can cluster and analyze operational logs, lock the cause of errors, and provide diagnostic suggestions intelligently.
DataWorks provides three monitoring methods: global rules, custom rules, and baselines.
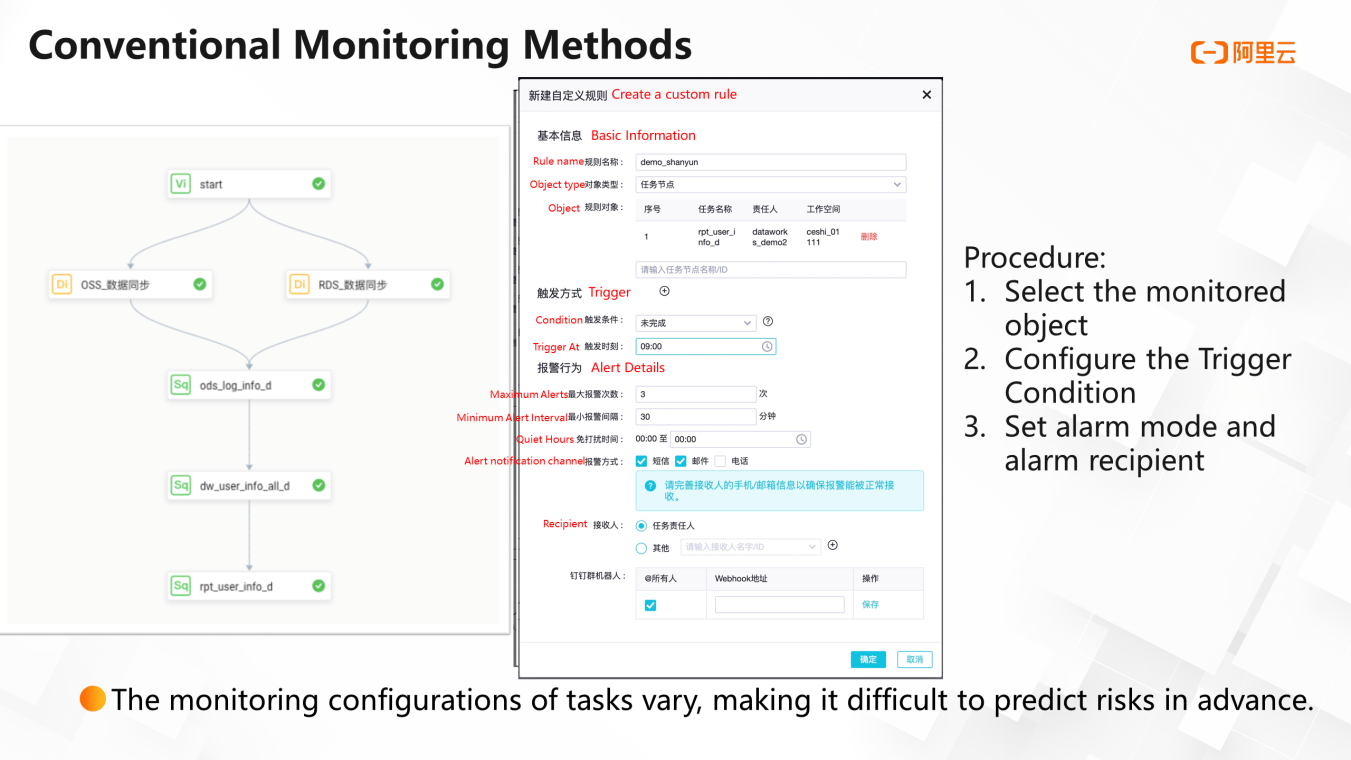
As shown in the following figure, this simple workflow contains six nodes. You can create a custom rule to receive alerts when a task error occurs. This rule can be set through three steps. First, select a node as the monitoring object. Next, set trigger conditions, such as error. Then, set the number of alarms, minimum alarm interval, do-not-disturb time, alarm method, and alarm recipient in detail. Supported methods include SMS, email, telephone, and DingTalk. If you want to monitor errors on multiple nodes, you can add multiple monitoring objects to the settings panel.
In addition to the success of the task, users will care about the time when the task is completed because the scheduled completion of the task means data is produced on time to ensure the normal operation of other applications that consume these data.
How can you detect possible upstream blocking or resource shortage?
Here, you can set the alarm trigger condition to incomplete and set a trigger time. For example, if the task is not completed at 9:00, you will receive an alarm. This is the case of a single node. If it is multiple nodes, it is troublesome to set a completion time for each node. This time can only be set by the user's experience value, and the reference significance is relatively limited.
Task execution depends on the normal completion of upstream tasks. The configuration of a single node cannot sense the risk of upstream tasks. Therefore, when users receive alarms, problems have often occurred already. This is the disadvantage of custom rules or regular monitoring solutions. It is difficult to predict risks in advance because the detection configurations of tasks are different. When the workflow becomes complicated, the problems above will become more serious. It is even more difficult for multi-node tasks to sort out which tasks need to be monitored. It will cause a large number of tasks to generate a large number of alarms, and users cannot quickly locate the cause of the fault from this alarm information.
There are millions of instances running at the same time every day in Alibaba. How can Alibaba efficiently monitor such a large number of tasks? The answer is the baseline.
In the operation and maintenance center Intelligent Monitor, the word intelligence is reflected in the baseline. Users only need to add important nodes to the baseline, and the upstream of this node will be automatically included in the monitoring scope of the baseline. The system will also automatically infer the node startup time and completion time. Once an exception occurs in the upstream task, an alarm will be generated. The content of the alarm includes errors and slowdowns. At the same time, a Gantt chart is provided to help users quickly lock the bottleneck nodes in the entire workflow.
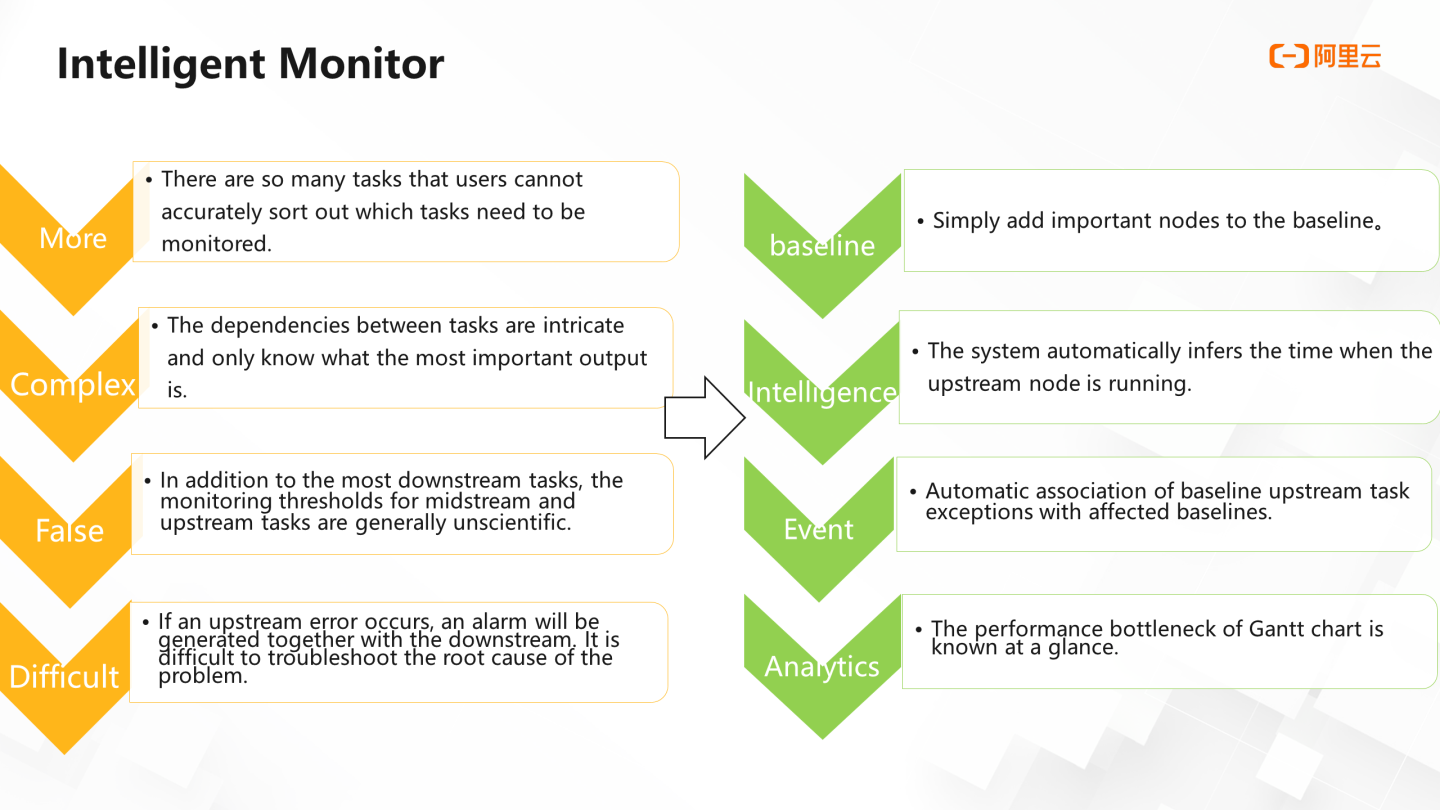
The business process in the following figure contains 12 nodes, where K represents the key output node and can consume data output reports. Leaders need to read this report at 9:30 every day.
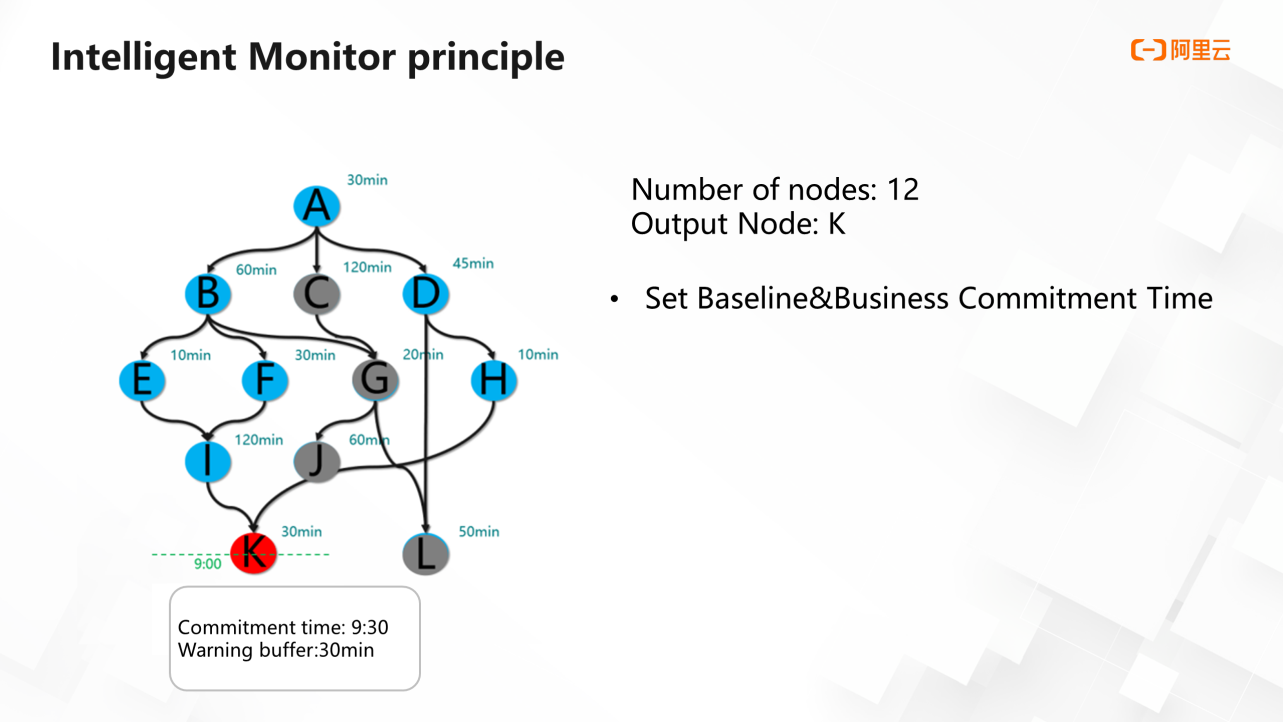
Under this background, if the baseline function is used to make sure leaders can see the correct report at 9: 30 every day, first of all, it is necessary to set a baseline for node k, set the commitment time of this baseline to 9: 30, and give it an early warning space of 30 minutes.
The image above shows all the operations for setting a baseline. This operation will trigger actions in some columns of the system. First, the system will include several nodes that affect the output (blue nodes) into the monitoring scope of the baseline, and other gray nodes will not be included in the monitoring scope. Therefore, when the blue node has a problem, an alarm will also be generated.
The following shows the time that each task needs to start running based on the commitment time of the baseline and the long history of each task run time. Take the K node as an example, the commitment time is 9: 30, and the warning buffer is 30 minutes, so K needs to run at 9:00. The average uptime of k is 30 minutes, so k needs to start running at 8: 30. The average uptime of the I node is two hours, so it needs to start running at 6:30. By analogy, node A needs to start running at 4:30. This way, you can find a key link, or the link with the longest execution time, as shown in the following figure:
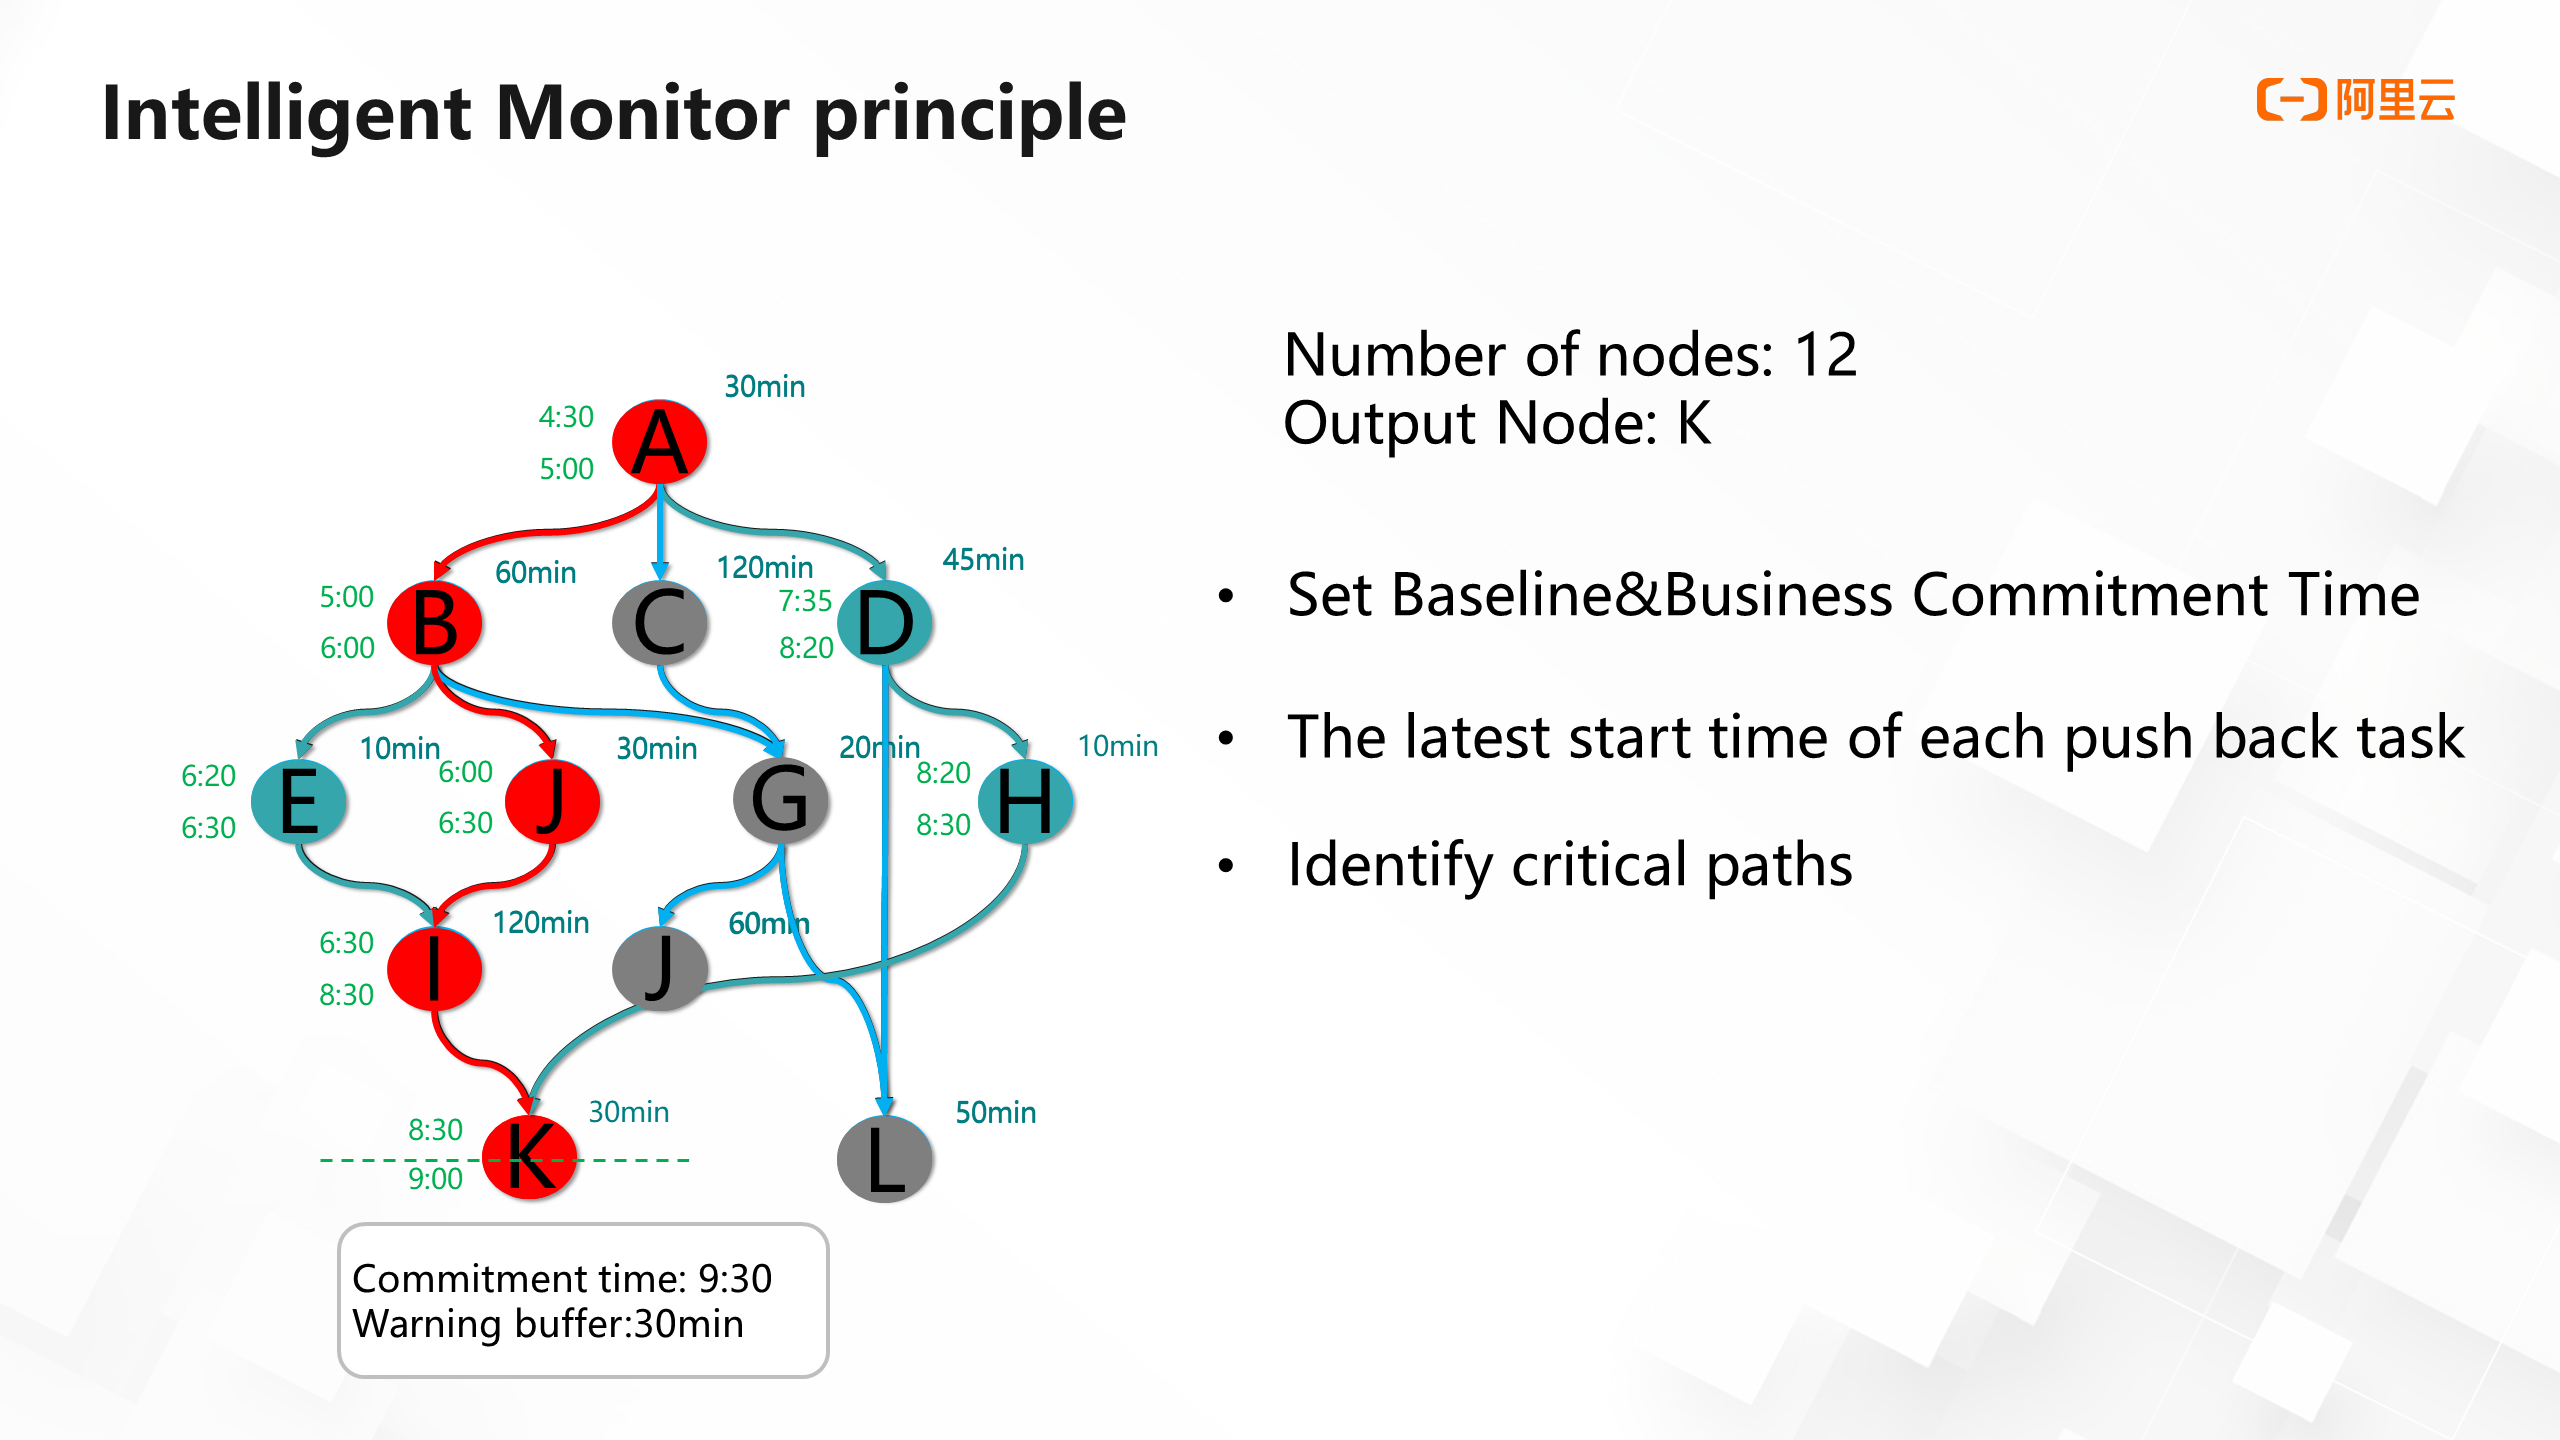
Key links are not static. They change at any time according to the operation of the task. The system dynamically adjusts key links. For example, if the uptime of node E changes from 10 minutes to 40 minutes, the critical path will become ABEIK. If the node on the critical path slows down, the user will receive an alarm. At the same time, the system always calculates the estimated completion time of this baseline. If the estimated completion time is later than the promised time minus the duration of the warning buffer, you will also receive an alarm from the baseline.
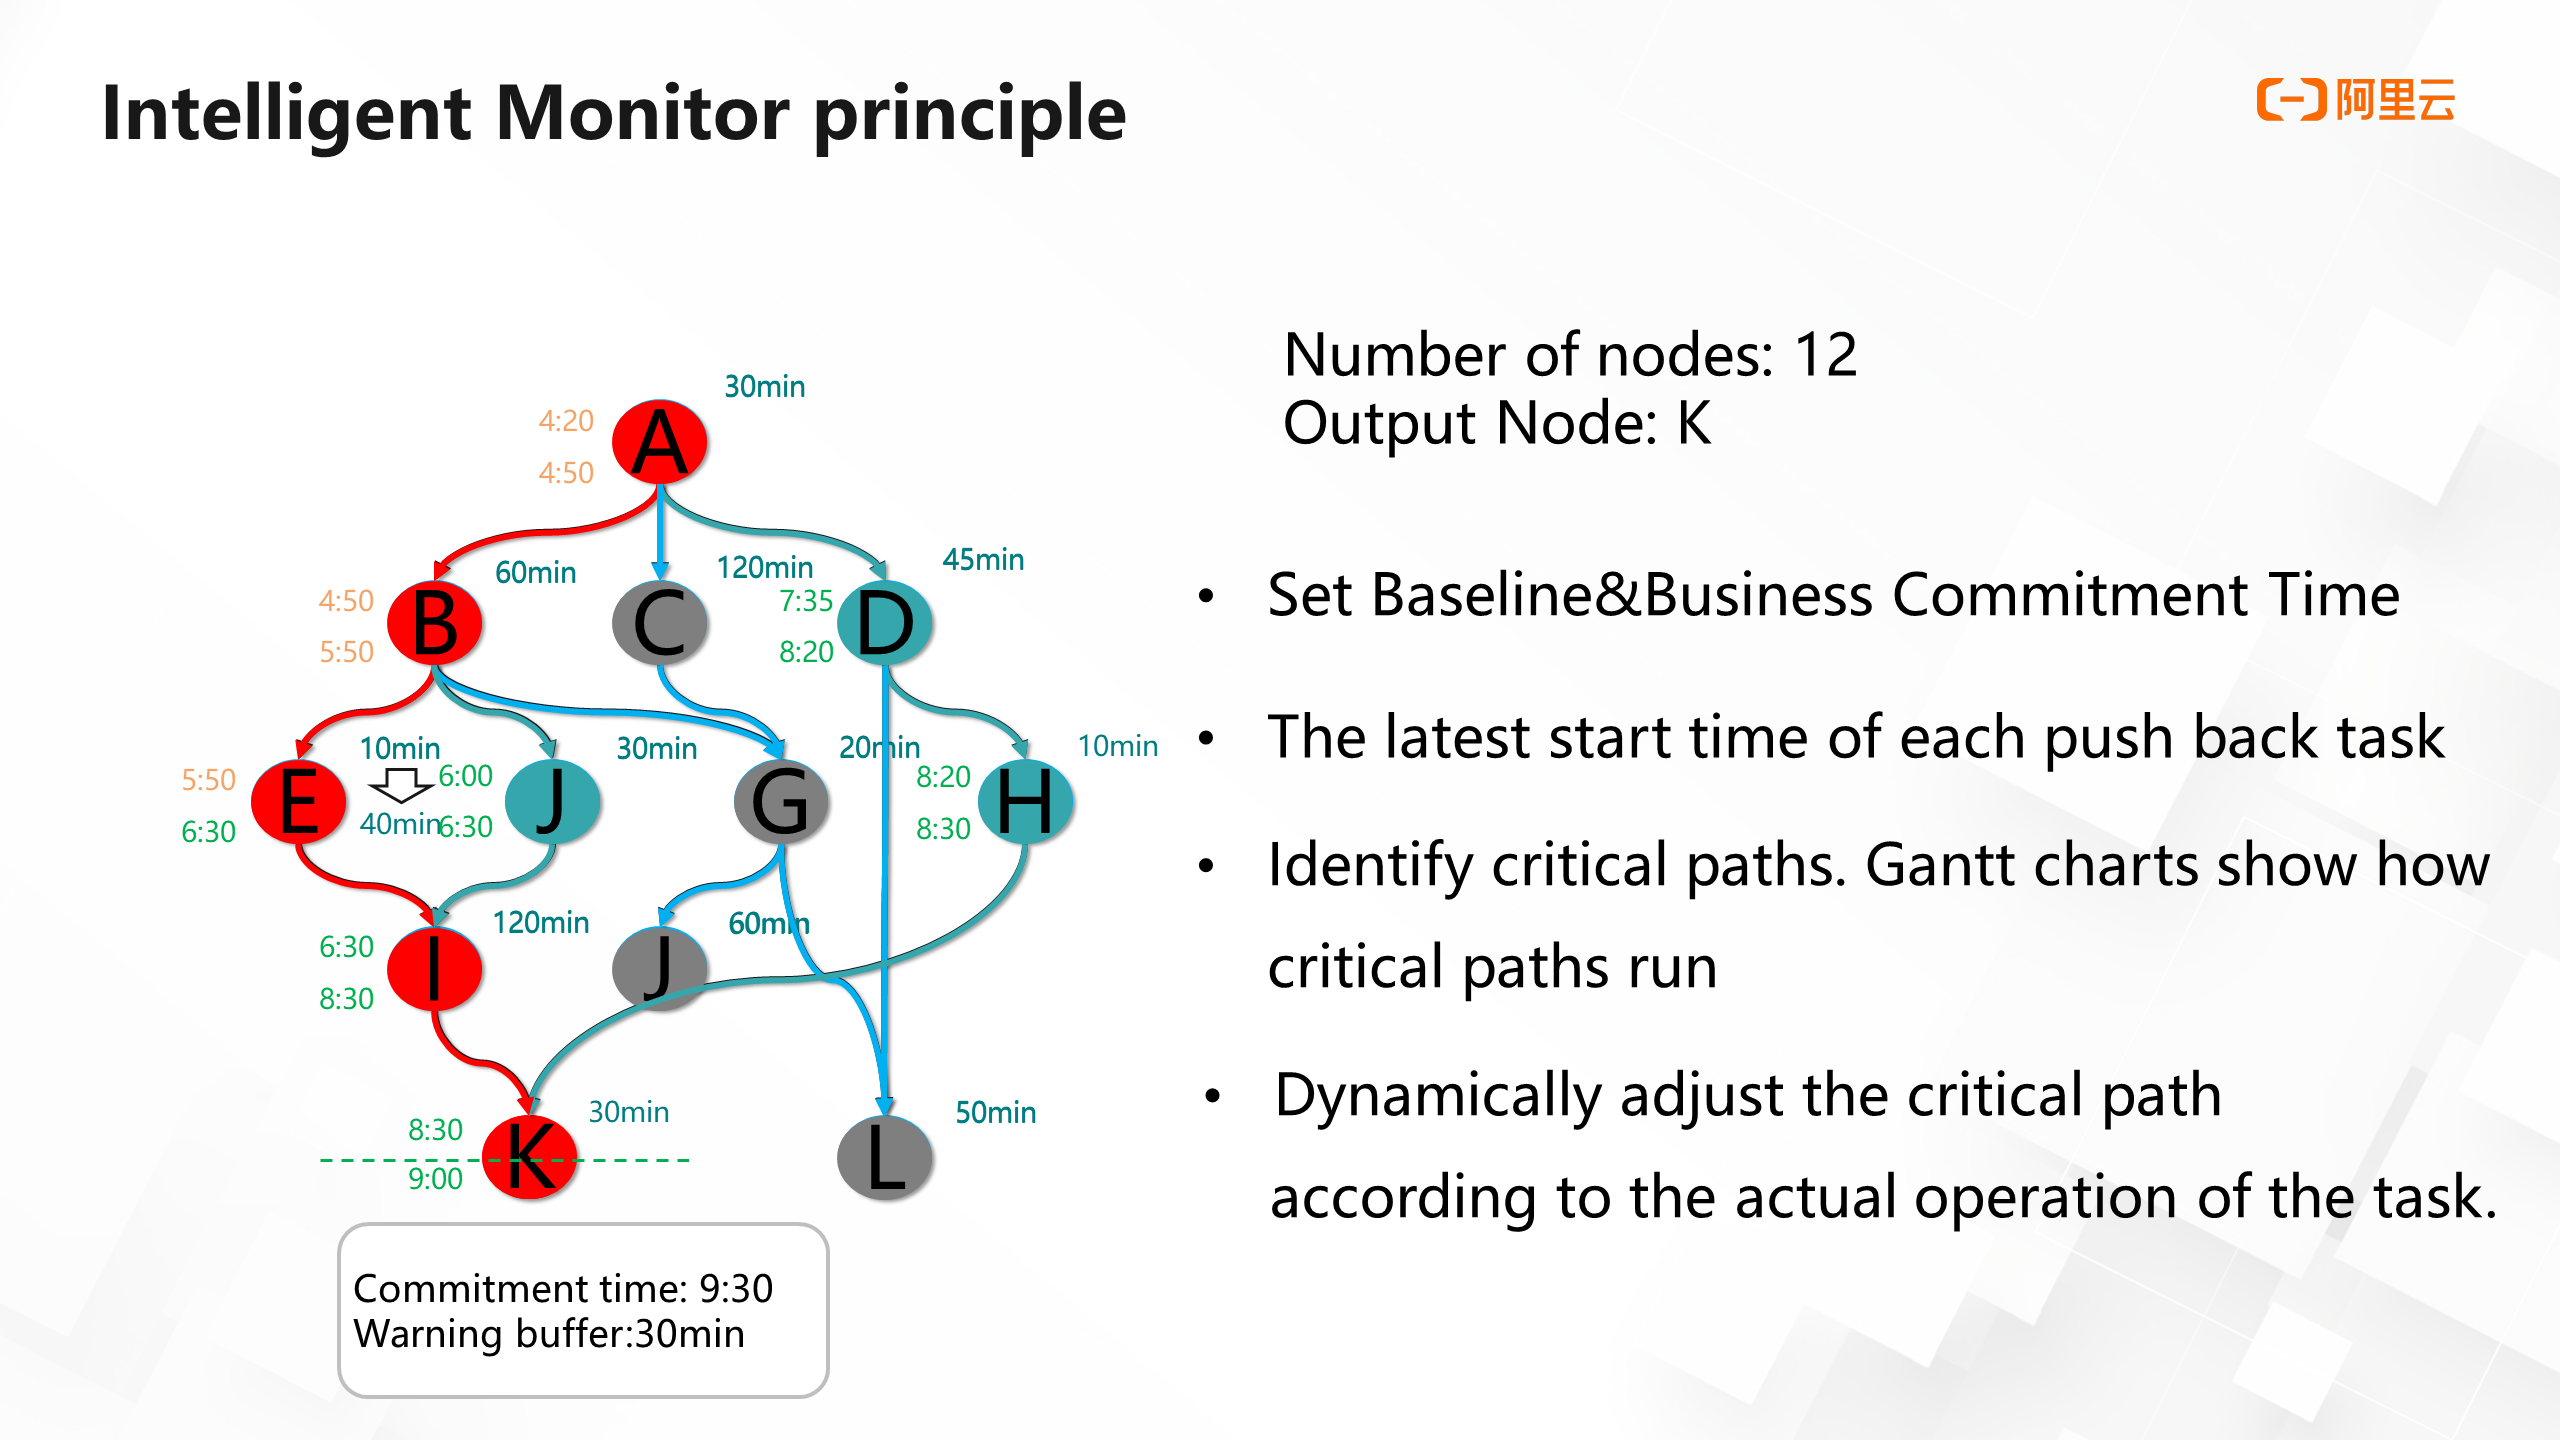
Therefore, if the K node is placed on a baseline, the K node and any anomalies that affect the output of this node will be monitored. This way, users can gain insight into all exceptions that affect this important node through this simple configuration baseline operation.
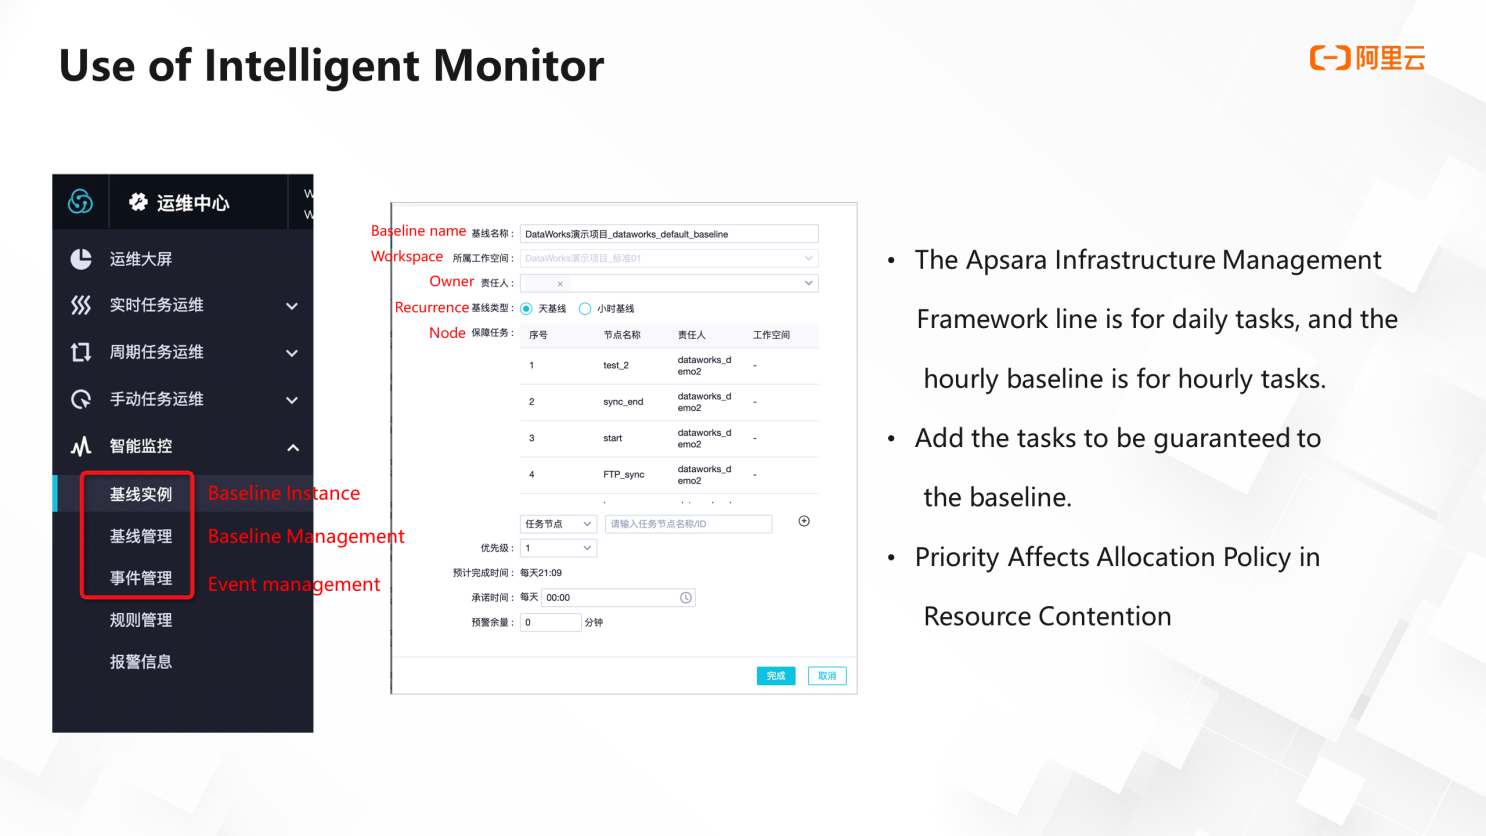
The baseline is in the Intelligent Monitor menu of the operation and maintenance center. You can create a baseline through baseline management. The baseline types include the Apsara Infrastructure Management Framework line and hour baseline for daily tasks and hour tasks, respectively. Then, add the tasks to the baseline and set the priority. A higher priority is allocated when resources are preempted. Finally, set another commitment time and warning buffer to complete.
DataWorks users can use the mobile version of DataWorks when they receive task alerts, permission approvals, or product expiration reminders when they go home after work or during business trips.
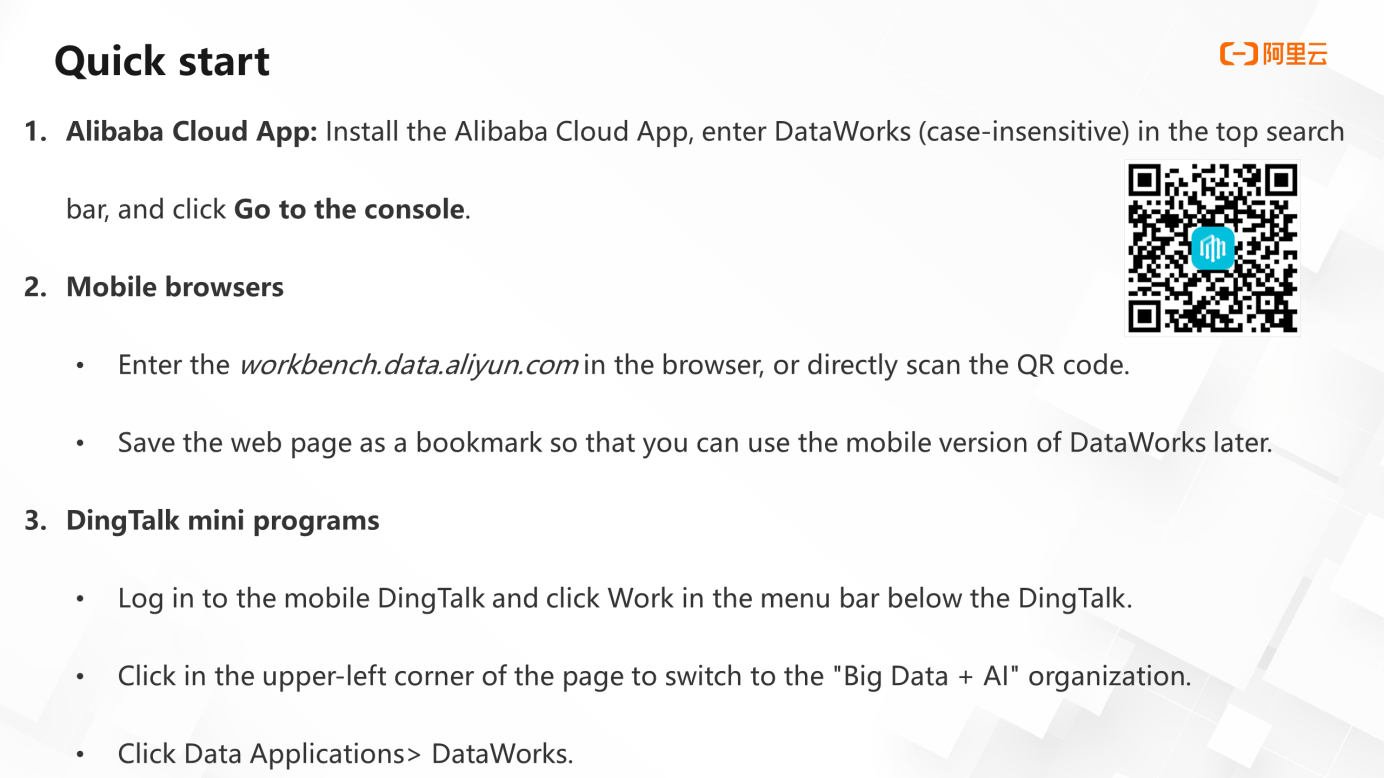
There are three ways to use mobile DataWorks: the Alibaba Cloud app, mobile browser, and DingTalk applet.
The first method is through the Alibaba Cloud app. Install the Alibaba Cloud app on your mobile phone. Enter DataWorks in the search bar and click Go to the console.
The second method is through the browser. Enter workbench.data.aliyun.com in the address bar of the browser to open the console or save the web page as a bookmark for next time
The third method is through DingTalk applets. Log on to the mobile DingTalk app. Click Work in the menu bar. Click the upper-left corner of the page to switch to the Big Data + AI organization. Then, click Data Application and find DataWorks to operate.
First of all, it is combined with alarm SMS, which makes task operation and maintenance faster. Users can directly open the mobile O&M function in the mobile browser through the link in the alarm SMS message and perform some rerun operations on tasks.
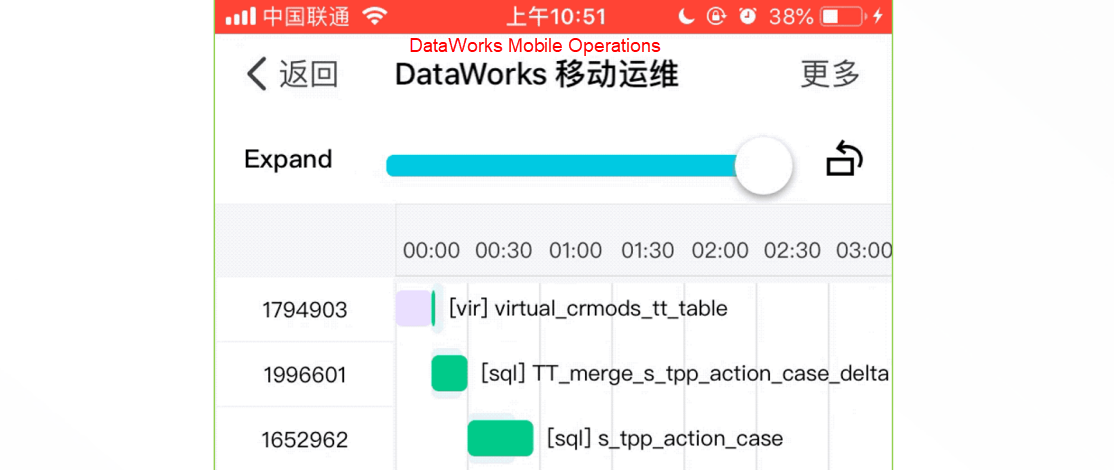
Second of all, under the premise of using the baseline, a very clear Gantt chart can be provided, and the horizontal and vertical screens can be switched freely.
Third of all, users can check the log with one key to the end or one key to the top.
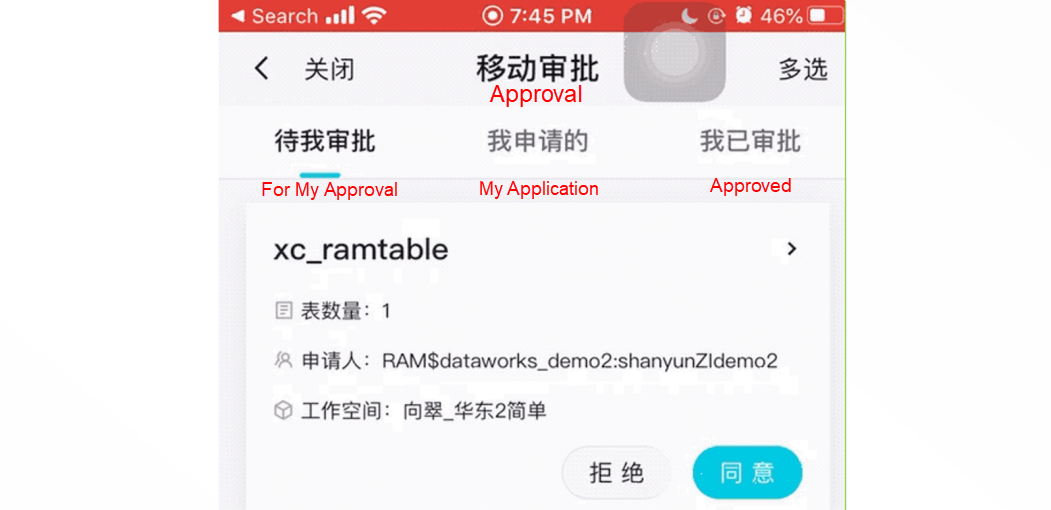
Finally, there is the mobile approval function. Users can directly process the approval of table permissions on their mobile phones. This function also supports batch operations. If the user opens the Alibaba Cloud app message notification permission area, when someone applies for permission, the approver will receive a push message from the app. Click this message to go directly to mobile approval for approval.
DataWorks Data Modeling - A Package of Data Model Management Solutions

1,397 posts | 492 followers
FollowAlibaba Clouder - February 11, 2021
Alibaba Cloud Community - March 29, 2022
Alibaba Cloud Community - March 29, 2022
Alibaba Cloud Community - March 4, 2022
Alibaba Cloud MaxCompute - December 22, 2021
Alibaba Cloud New Products - January 19, 2021

1,397 posts | 492 followers
Follow Bastionhost
A unified, efficient, and secure platform that provides cloud-based O&M, access control, and operation audit.
Learn More Managed Service for Grafana
Managed Service for Grafana displays a large amount of data in real time to provide an overview of business and O&M monitoring.
Learn More Big Data Consulting for Data Technology Solution
Alibaba Cloud provides big data consulting services to help enterprises leverage advanced data technology.
Learn More MaxCompute
Conduct large-scale data warehousing with MaxCompute
Learn MoreMore Posts by Alibaba Cloud Community