By Yang Yongzhou, nicknamed Chang Ling.
In this three-part article series, we've been taking a deep dive into the inner-workings of Alibaba's big logistics affiliate, Cainiao, and take a look at the "hows" and "whys" behind its logistics data platform.
In particular, in this second part of this three-part series, we're going to look at how elastic scheduling works at Cainiao, the mode involved with the scheduling application, its advantages, and also we'll start to take a detailed look at the ark architecture connected with Cainiao's elastic scheduling system.
Continue reading to learn more about Cainiao: Why Cainiao's Special and How Its Elastic Scheduling System Works and The Architecture behind Cainiao's Elastic Scheduling System (Continued).
To present, Cainiao has been mainly implementing elastic scheduling for stateless application clusters. What this means is that, with the system that is used, each cluster will have more than fifteen containers before the cluster will connect to the elastic scheduling system.
During any one single day, the average CPU usage of an application cluster connected to this system is over twenty percent, which is the weighted average of the CPU usage of this particular application cluster at Cainiao during several different periods of an entire day, and the number of containers of this application cluster in a single day. Then, related to this, the total number of containers scaled every day is over three thousand in total.
During the Double 11 Shopping Festival in 2017, elastic scheduling, used as an auxiliary tool at that time, conducted scaling operations for some application clusters from midnight, at the very start of all the logistics madness to follow. With this, the ratio between the number of physical CPU cores consumed by Cainiao and the number of parcels and packages that Cainiao had to handle with CPU resources was significantly reduced.
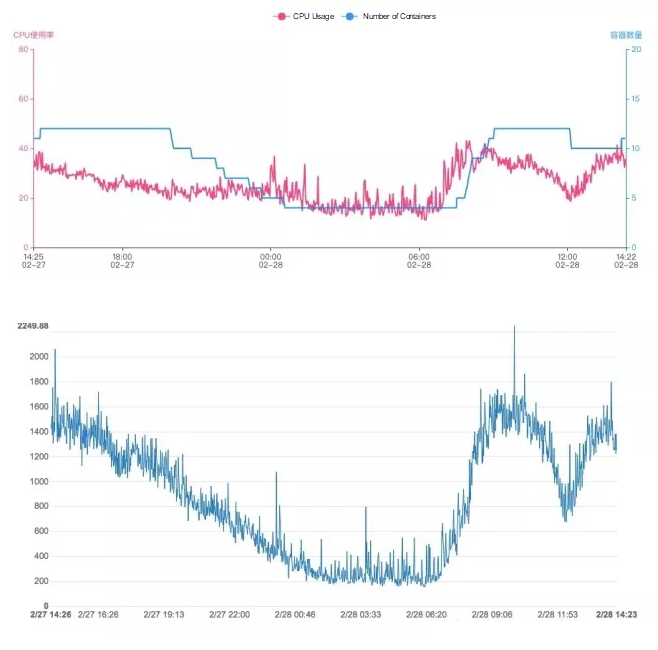
Now consider these figures and this comparison. Below, in the first graph, you can see the change curves of the CPU usage and the number of containers of an application cluster in a day compared. Then, in the second graph, you can see the change curve of the traffic of a core service in this application cluster during the same period of time.


The elastic scheduling system of Ark from the very beginning was not intended just to provide Cainiao with more than the ability to elastically operate cluster resources. Instead, the aim was also to manage costs and optimize stability for all users of the platform. Purely manual configuration is rather impractical. One reason, of course, is that target applications are largely different in terms of several different aspects and manual configuration would involve modifying thousands of configuration items that are, in all actuality, dynamically changing.
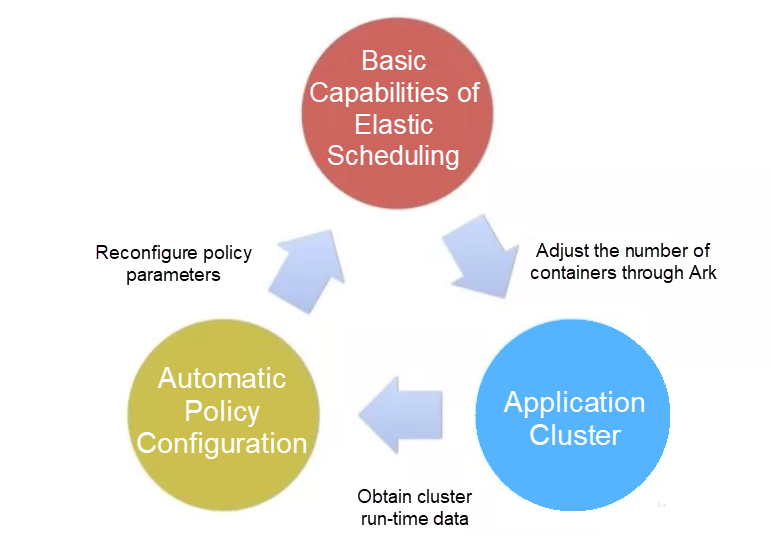
Therefore, the elastic scheduling system of Ark provides a closed-loop feedback mode, as you can see in the graphic above. The elastic scheduling system of Ark makes scaling decisions based on the running statuses of application clusters and the configured policy parameters of different application clusters, and the container execution system of Ark then adjusts the number of containers in the relevant application clusters. Application clusters are affected by the number of containers in them, and therefore may perform differently as a result.
For example, the average CPU usage of an application cluster varies during the scale out process, and then service response times decrease within a certain range. Also involved in this process, application clusters store historical data offline and provide real-time data for the elastic scheduling system to make decisions online. Standard monitoring systems, such as Alimonitor and EagleEye, also provide such data services. Automatic policy configuration tools retrieve the historical data on a regular basis and configure different policies for different application clusters based on certain algorithms. As such, the decision-making of the elastic scheduling system is affected again.
Now, in this section, let's go into the nitty gritty details of some of the advantages of this closed-loop feedback mode.
That is, when an application cluster has just been connected to the elastic scheduling system, most of the policy parameters of this application cluster are set to the default settings. However, once after this application cluster has run in the elastic scheduling system for a period of time, the policy parameters for this cluster will be constantly modified to improve elasticity, based on the automatic evaluation method.
To understand the degree to which this is helpful, it helps to consider the corresponding service security policy as an example. At the real-time decision-making stage, a service security policy is used to compare the current service response time with the related Service Level Agreement (SLA) threshold. Then, when elastic scheduling is enabled, the SLA of a service is obtained based on the historical response times before this service is connected to the elastic scheduling system.
To speak more generally, the response time of a service in an inelastic state is hugely different from the response time of this service in an elastic state. That is, most containers will be scaled out because the associated SLA threshold may be relatively low at first. In fact, the violation of the SLA threshold by the service response time numbers is the very top reason for the system to scale out, typically. This phenomenon is most often captured by the analysis task that is executed regularly each day, and the SLA threshold is determined as being unreasonable through a related analysis procedure. Based on the operating status in several days prior, the SLA is recalculated to improve the rationality of the threshold.
To understand this better, consider the SLA threshold of service response times as an example. When considering a specific service in full, you need to consider several aspects. For example, you'll have to consider the business logic of the service, its related call chains, and also the tolerance of upstream services, so on and so forth. But, if you're going to do this for every service, then you'll never finish. At Cainiao, there's thousands of services to think about. And changes are always happening. New services go online and old ones offline every day, and the business logic connected with Cainiao services may also change, and relevant configurations may need to be regularly updated—and, in fact, they do.
Therefore, as a smarter way of doing things, this mode provides a means for automatic policy configuration, considering a massive number of parameters quickly at a higher level of abstraction. Service response time is one important thing to consider, but it is based on a widely applicable assumption that, for the greater part of a day, service response time is in a reasonable state. So, it cannot be considered alone. Moreover, a mathematical SLA threshold is obtained through probability distribution calculations, and the actual distribution of service response times can also be obtained based on historical statistics.
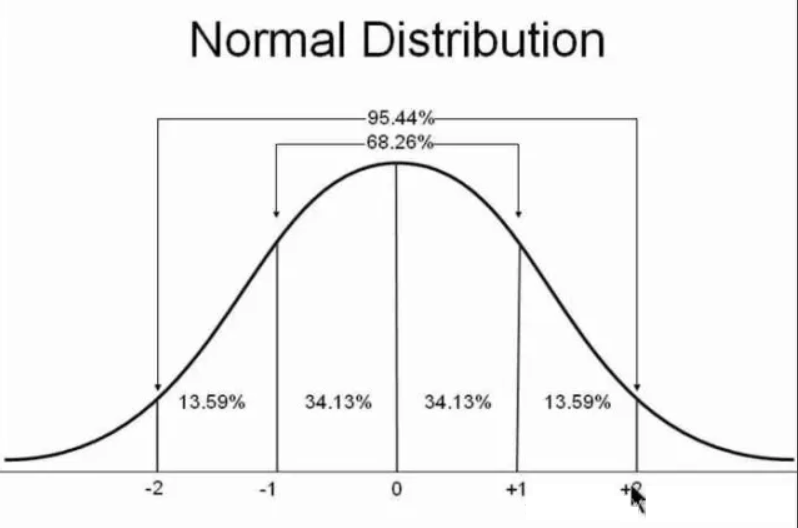
To make this more clear, take normal distribution as an example. The average service response time and the standard deviations of service response time distributions within a period of time are obtained and then can be calculated as shown below. As such, the thresholds to be set under different probabilities can be obtained.

Shown above is a normal distribution curve. If we set the threshold as the average response time along with two standard deviations, and also assume that the service response time is high for nearly 33 minutes in a day as roughly calculated with the formula 1,440 minutes × (1 - 0.9544)/2. A mathematically reasonable threshold is obtained.
The logic we're using here, of course, only accounts for a small part of the logic of service security policies, which will be described later in three-part article series. However, from the above, we can see that mathematical threshold for any service can be automatically and rapidly obtained as long as the historical monitoring data of this service is available.

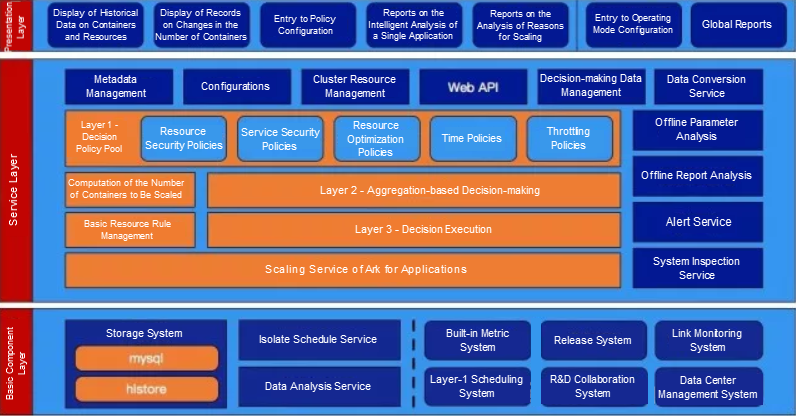
In this section, I'd like to now address the elephant in the closet. And, it's a big one. That's the actual scheduling system of the ark architecture used at Cainiao. Consider the graphic above for some reference on how the system works.
Note that, given the limited space we have in this section, the complete architecture of the elastic scheduling system of Cainiao's Ark won't be explained in full detail in this section. However, we will slowly reveal more and more about it in other sections of this three-part series. So that, you can understand every part of this fascinating elephant we've got here.
In our exploration of Ark's architecture, let's first take a look at the three-layer decision-making model used by the elastic scheduling system of Ark. You can clearly see the three major layers of this architecture in the graphic above.
This layer comprises several different policies and supports rapid extension. Policies are logically isolated from one another. After computing is completed for each policy, actions like scaling out, scaling in, and keeping things unchanged, as well as relevant quantities are generated separately. Then, to adapt to the heterogeneity of applications, different policies for each application cluster can be enabled or disabled based on the actual situation happening at Cainiao.
This layer collects the decision-making results of all policies from the top layer, and obtains a merged <action, quantity> group based on aggregation rules. The rules at this layer are simple. When decision-making results for both scale-out and scale-in are present, the decision-making result for scale-out prevails, whereas the decision-making result for scale-in is ignored. When multiple decision-making results for scale-out are present, the result that involves the largest number of containers to be scaled out prevails. When multiple decision-making results for scale-in are present, the result that involves the smallest number of containers to be scaled in prevails.
This layer uses some rules and then notifies the scaling service whether to scale out or scale in containers and how many containers will be involved. Moreover, when scale-in is concerned, this layer also considers the specific containers to be scaled in. When scale-out is concerned, this layer considers the specifications of containers to be scaled out and the data center to which the containers will be scaled out. The rules considered during decision execution are very complex.
Given that the rules to consider during the decision execution process are relatively complex, in this section, we are going to consider some of the more important rules:
For example, if scale-out is in progress, when the target number of containers in this scale-out is greater than the target number of containers being scaled out, another scale-out request is initiated based on the difference between both numbers. As such, parallel scale-out can be achieved. When the target number of containers in this scale-out is smaller than the target number of containers being scaled out, this scale-out request is ignored. If scale-in is in progress, the scale-in is stopped immediately, and a scale-out request based on the target number of containers and the current number of containers is initiated.
Elastic scheduling currently supports two modes, which are automatic scaling and manual approval. If the current application cluster is in manual approval mode, the administrator must examine the decision and determine whether to approve it.
The maximum and minimum values can be configured for application clusters. Decision execution ensures that the scaling tasks initiated by the elastic scheduling system will not make the final number of containers in an application cluster greater than the maximum value or less than the minimum value set for this cluster.
For a single cluster, the decision execution layer is strongly consistent. Moreover, the decision-making result output from the second layer is the number of target containers to be reached in the cluster. This design ensures that the first two layers are completely stateless and idempotent. Each of the three layers needs to focus only on its own decision-making logic. As such, the "changed and unchanged" business logics are separated, and final scaling decisions are verified layer by layer. This three-layer decision-making model is the basis for achieving the goal of "covering most Cainiao applications."
As a high-availability middleware product that has withstood the test of major promotional campaigns and provides asynchronous task scheduling services for many core businesses of Cainiao, ISS is highly reliable in terms of functionality, performance, and stability.
The elastic scheduling system of Ark adopts the "short-frequency and periodic active pulling" mode to acquire online data. Through the periodic asynchronous task scheduling function provided by ISS, a separate periodic ISS task is automatically registered for each application cluster when this cluster is connected to the elastic scheduling system. When a task is initiated, ISS randomly selects from among the target clusters, and manages the lifecycle of the task. In this case, the task can be retried. In addition, the ISS client can also protect resources. When a process in a cluster is overloaded, the target machine is replaced for a retry.
Alimetrics is a built-in metrics system that is accompanied by web containers and contains a wide range of metrics. When the fine-grained monitoring data of application clusters needs to be obtained, the pressure from data querying, reading, and transmission is allocated to each destination container, rather than a centralized data center. This design does not produce a data silo in data sources, and therefore depending on multiple data sources is much better than depending on a centralized data service in terms of reliability and pressure tolerance.
High performance can be achieved when data in a time window of less than one hour is obtained through Almetrics, and the interference on applications is very small. In this way, the cost of retrying computing tasks is reduced. Based on this capability, the computing tasks initiated by the elastic scheduling system can retrieve all the monitoring data in a time window during each execution, without the need to maintain a sliding window in the memory. This is the basis for stateless computing of the elastic scheduling system.
Regardless of the application cluster status, the first and second layers perform short-frequency periodic computing, and tasks are sent to the third layer only when scaling is needed, which happens during only a small portion of a day. Therefore, the range of strong consistency is limited to the third layer, which has the minimum impact on performance while ensuring reliability. The number of decisions output from the second layer to the third layer is given in the form of "number of target containers" rather than "number of scaled containers." In this way, even if multiple elastic decision-making tasks are executed for an application cluster at the same time and multiple decision-making results are output to the third layer, the final scaling behavior is not affected.
Why Cainiao's Special and How Its Elastic Scheduling System Works
The Architecture behind Cainiao's Elastic Scheduling System (Continued)

2,593 posts | 794 followers
FollowAlibaba Clouder - January 2, 2020
Alibaba Clouder - January 2, 2020
Alibaba Clouder - May 13, 2021
Alibaba Clouder - December 13, 2019
Alibaba Clouder - January 22, 2020
Alibaba Clouder - December 26, 2018

2,593 posts | 794 followers
Follow ApsaraDB for MyBase
ApsaraDB Dedicated Cluster provided by Alibaba Cloud is a dedicated service for managing databases on the cloud.
Learn More Server Load Balancer
Respond to sudden traffic spikes and minimize response time with Server Load Balancer
Learn More Security Center
A unified security management system that identifies, analyzes, and notifies you of security threats in real time
Learn More Architecture and Structure Design
Customized infrastructure to ensure high availability, scalability and high-performance
Learn MoreMore Posts by Alibaba Clouder