The Alibaba Cloud 2021 Double 11 Cloud Services Sale is live now! For a limited time only you can turbocharge your cloud journey with core Alibaba Cloud products available from just $1, while you can win up to $1,111 in cash plus $1,111 in Alibaba Cloud credits in the Number Guessing Contest.
By Wanqing
The several benefits of this project were obvious. We had done a lot to optimize the design and improve risk prevention. We needed to integrate fault drills into the acceptance process. Fault drills allow us to find minor errors or design defects in advance.
Certainly, we also made some mistakes. A compensation pipeline, which was rarely used in normal times, failed due to our attacks. We later found that this potential risk was caused by a certain change. I felt that fault drills were worth performing. After all, no one can guarantee that an accident due to a certain fault would not be serious.
In addition to the benefits for the system, the project also benefited the staff. For example, after participating in this project, test developers and R&D engineers became proficient in using our trace and log systems and gained a more thorough understanding of our SOA framework. Actually, many of the potential risks and root causes were found by the test developers through persistent testing. Certainly, highly capable QA personnel were also very important. It was equally important to improve the capabilities of QA personnel.
Of course, in addition to the work of the test team, we also insisted on carrying out unit tests. The code line coverage sat between 80% and 90% for a long time in 2016.
As data volumes grew, we encountered a series of problems.
At the beginning of 2016, the performance was mainly restricted by databases. As mentioned above, we implemented database and table sharding to mitigate this bottleneck. By June 2016, our major concern had shifted to Redis. At that time, Zabbix could only monitor the operating status of the machines and therefore was phased out. The SRE team set up a more efficient machine metric collection system to directly read data from Linux. However, the overall operating status of Redis was still completely a black box.
Ele.me also encountered a lot of problems with Twemproxy and CODIS. At that time, redis-cluster was not widely used in the industry. Therefore, we developed a Redis proxy, corvus, that reported various metrics, allowing us to monitor the memory, connections, hit rate, the number of keys, and transmitted data of Redis. This proxy was launched just in time to replace Twemproxy, marking a turnaround in Redis governance.
We participated in this migration and received a real shock.
At that time, we used Redis for three main purposes: (1) caching data, such as tables and APIs; (2) deploying distributed locks, which were used to prevent concurrent read and write operations in certain scenarios; (3) and generating serial numbers for merchants. The code had been written several years ago.
The table-level caches and API-level caches were configured in the same cluster, and other caches were configured in another cluster. However, the framework provided two clients that had different fault-tolerance mechanisms that specified whether the cached data was a strong dependency or whether cache breakdown could be tolerated.
As we all know, in takeout transactions, orders are pushed quickly within a short period of time at the transaction stage and therefore order caches are updated more frequently. After a brief canary verification of the availability of the Redis cluster, we migrated all the data to the new cluster. I have forgotten the details of the specific migration plan, but we should have selected a more stable plan.
Specifically, the memory size of the original cluster was 55 GB. Therefore, the OPS engineer prepared a cluster with a 100 GB memory. About 10 minutes after the data was migrated, the memory of the new cluster became full.

We came to a surprising conclusion: The 55 GB memory of the old cluster had previously been exceeded.
According to the monitoring metrics, the number of keys increased rapidly and the time to live (TTL) decreased rapidly. We quickly determined that the problem was caused by the query_order and count_order APIs. At that time, the query_order API handled about 7,000 QPS and the count_order API handled about 10,000 QPS. The response time (RT) of these APIs was 10 ms on average, which was normal.
In our business scenarios, these two APIs were mainly used to query a restaurant's orders generated within a specified time range. To ensure that the merchant could see new orders as soon as possible, we used the polling refresh mechanism on the merchant client. However, this problem was mainly caused by query parameters. These two APIs adopted API-level caching. API-level caching generates a hash based on input parameters, uses the hash as the key, uses the return value as the value, and caches the key and the value. The TTL was within seconds, and there seemed to be no problems If you query the timestamps of the parameters and found that the deadline time was the last second of the current day, this meant no exceptions had occurred. Many of you may have guessed that the deadline timestamp was actually the current time, which is a sliding time. As a result, the miss rate of the cache was close to 100% and new data was frequently inserted into the cache.
The memory collection policies of the old and new clusters were different. As a result, frequent garbage collection (GC) on the new cluster caused frequent fluctuations in performance metrics.
The caches of these two APIs were actually useless. After we rolled back the data to the previous day and performed canary release to completely remove the caches of the two APIs, we migrated the data between the clusters again and split API-level caches and the table-level caches into two clusters.
Then, we found some interesting things.
To begin with, let's take a look at the general peak value curve for business order quantities. In the takeout industry, two peaks occur per day, one at noon and the other in the evening. The peak value at noon is significantly higher than that in the evening.
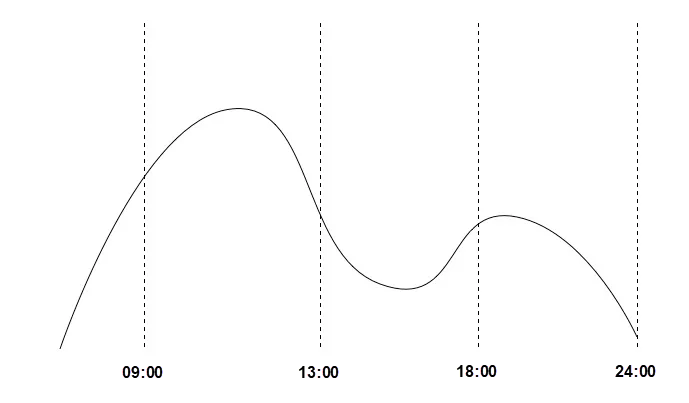
At 3:00 p.m. on the day we migrated the cluster, the memory became full again and the memory usage curve approximated that in the following figure.
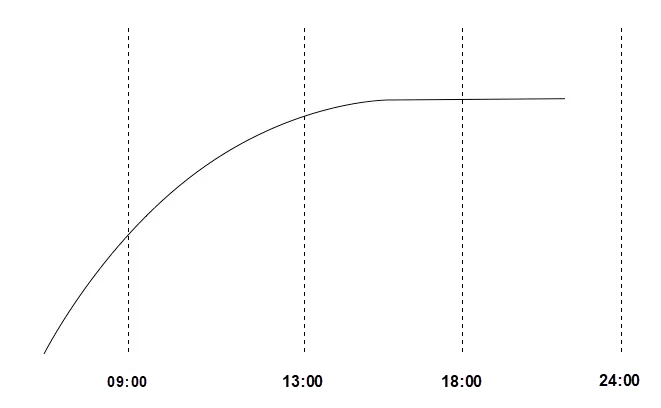
After emergency scale-up, we carefully observed the curve until the evening, when the curve became as in the following figure. According to the final curve, the hit rate increased to between 88% and 95% and later rose to more than 98%.
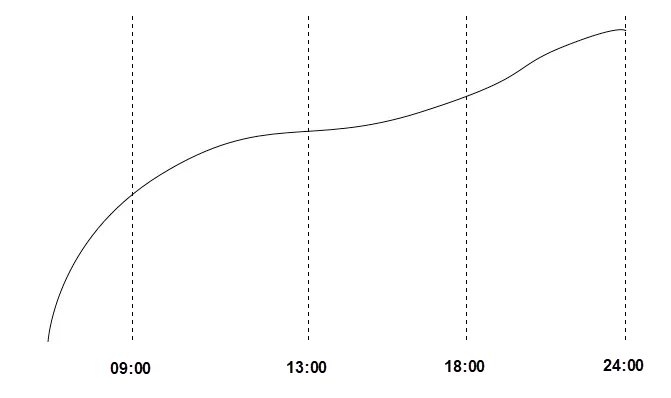
Why was the pattern of this curve different from that of the business peak value curve?
This was related to the business features. Multiple polling scenarios occurred on the merchant client at that time. The most time-consuming scenario was to query orders from the last three days and another time-consuming scenario was to query orders from the current day.
During polling, the backend queried more entries than those required on each page at the frontend. In addition, not every merchant's orders generated on the current day exceed one page. As a result, as the day progressed, the preceding problem occurred.
Why was this problem not indicated by the previous performance metrics? First, this was related to memory recycling policies of the old Redis cluster. Second, the QPS level was very high. If you view only the average response time, the results were of little reference significance, because low values were averaged with higher values, increasing the average hit rate.
Then, after resolving this problem, we were confronted with more new problems.
Around 1:00 or 2:00 a.m., I was woken up by the on-call system, which detected that the memory usage had abruptly spiked.
We found that this problem was caused by an API with an abnormal call volume. Once again this API turned out to be query_order. The clearing and settlement system was just transformed a few days earlier. Also, late at night, we checked due orders. Our accounting period was relatively long because some orders have long refund times. As a result, a large number of historical orders were pulled, occupying a large amount of memory. However, the validity of table-level caches was 12 hours. If we did not clear the caches, problems would occur during the morning business peak. The next day, we provided the clearing and settlement system with a dedicated API that did not output data to the cache.
The main reason was that our service governance was not refined because we had implemented service-oriented operations less than a year ago. Anyone could call the service APIs that were exposed in internal networks. Our API protocols were also public and could be easily queried by anyone. In addition, senior engineers in the company usually used whatever was available or adding new things with no advance warning. The permissions to merge and release code in the Git repository had already been more strictly controlled from the end of 2015. However, the SOA had not been fully implemented and authorization for APIs was not supported until a long time later.
The use of Redis required a deep understanding of business scenarios and a focus on various metrics.
The following figure shows our caching mechanism at that time.
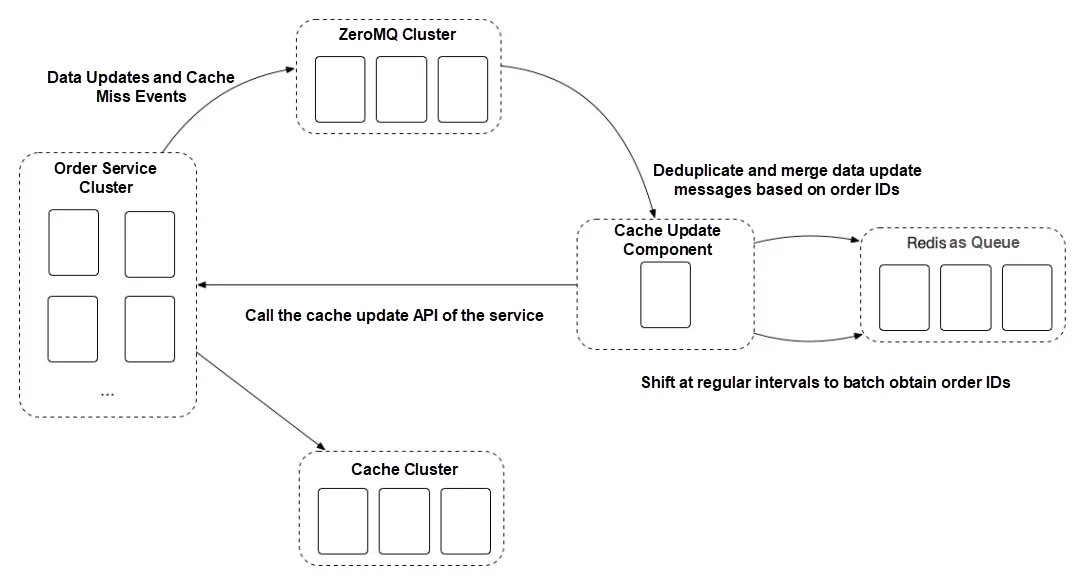
This architecture design had the following advantages:
This architecture was excellent in many scenarios.
However, this design also had the following disadvantages:
Our transformation was also driven by a minor accident.
The query function for merchant orders was actually based on the order status. Specifically, the queried orders must have been paid. However, some incorrect judgment logic was used at the backend of the order receiving system on the merchant client. This logic checked whether the serial number of the order is 0, which was the default value. If the serial number was 0, the logic inferred that the order had not been paid and then filtered out the order.
Due to this accident, the cache update component broke down, but no one noticed. Although this architecture was designed by some members of the framework team, it was so stable that this issue was almost forgotten. As a result, the cache was not updated promptly and outdated data was output. The merchant could not view some new orders right away, and when the merchant could view these new orders, they were canceled by the auto-cancelation logic due to order receiving timeout.
Later, we transformed the architecture as shown in the following figure.
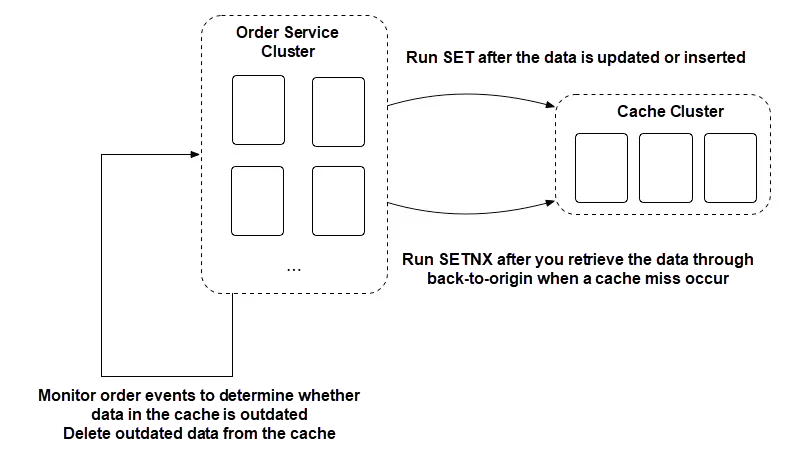
In comparison, this architecture had much fewer pipelines and therefore provided high real-time performance. However, to avoid blocking any process, we implemented fault tolerance, which required that a monitoring compensation pipeline be added. With this improvement, we immediately removed the dependency on ZeroMQ code and configurations.
After we shared the databases and tables, we had little confidence in RabbitMQ. Over the following few months, several exceptions occurred in RabbitMQ. It seemed that anything that could go wrong did go wrong. Unfortunately, although we felt that problems were going to occur, we didn't know where the problems would occur.
In the preceding sections, I mentioned that we set up an order message broadcast mechanism. Based on this set of messages, we optimized the high-frequency polling technology on the merchant client. We simplified polling by using long connections and a combination of push and pull operations. Let me briefly describe this solution. Assume a backend service on the merchant client receives an order message broadcast. If a new order, which has just been paid and become visible to a merchant, is received, an arrival notification will be pushed to the merchant client through a long connection. The merchant client then triggers an active refresh and plays the arrival sound to notify the merchant of the order. After optimization, the polling time interval was longer and the polling frequency was lower.

So what was the problem? The problem was that the overall process indicated by the blue line sometimes took less time than the process indicated by the red line. In other words, the time required to transfer a percentage of the requests over the public network and back to the private network was shorter than the time required to synchronize primary and secondary internal databases.
The merchant client team proposed performing polling on the primary database. It was totally insane. We would not agree with the proposal, because such a high frequency would definitely cause the database to crash. After all, the secondary database once crashed due to a high hit rate during polling. The proposal was not database-friendly even if the consumer side held requests locally for a period of time before consumption. After all, sometimes, being fast is not necessarily a good thing. So, what if we slowed down the process?
We changed the topology of the binding relationships to that shown in the following figure. The pink queue uses the dead-letter queue feature of RabbitMQ. Specifically, a timeout period was set for a message, and when the timeout period expired, the message was discarded from the queue or moved to another location.
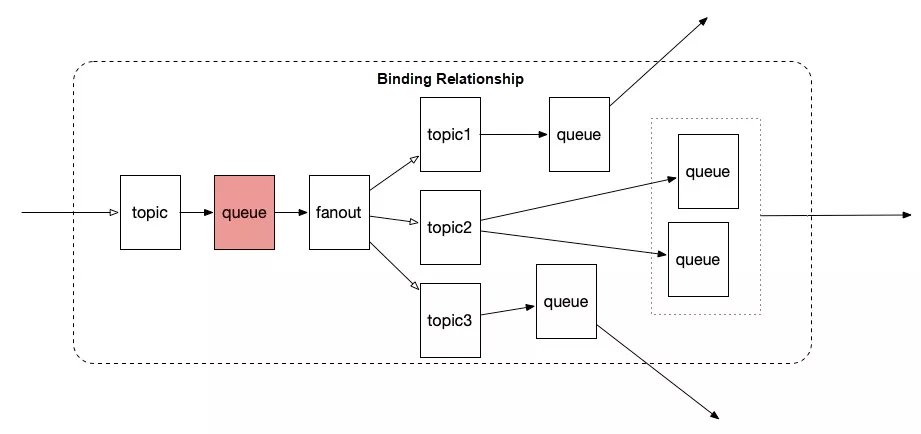
This resolved the immediate problem, but also created a potential risk. Engineers who have some experience in RabbitMQ and architecture design should be able to see the mistakes we made. Every broker stores meta information such as the binding relationship and uses this information for routing. However, messages were persisted in a queue and the queue was stored in only one node. In this case, the data previously stored in a cluster was now stored in a single node at the front of the topology.
In the RabbitMQ cluster accident I mentioned earlier, some nodes in our RabbitMQ cluster crashed due to related causes. Unfortunately, these nodes included the queue highlighted in pink. In addition, another problem was exposed. This topology did not support automated O&M, but required manual maintenance work. To rebuild a new node, we needed to export meta information from an old node and then import the meta information to the new node. However, this process had the potential to cause conflicts. Previously, we had little experience in declaring topics and queues and did not allocate queues based on the actual consumption status of consumers, causing some nodes to overheat. After striking a balance between automated O&M and load balancing, we randomly selected a node to declare a queue.
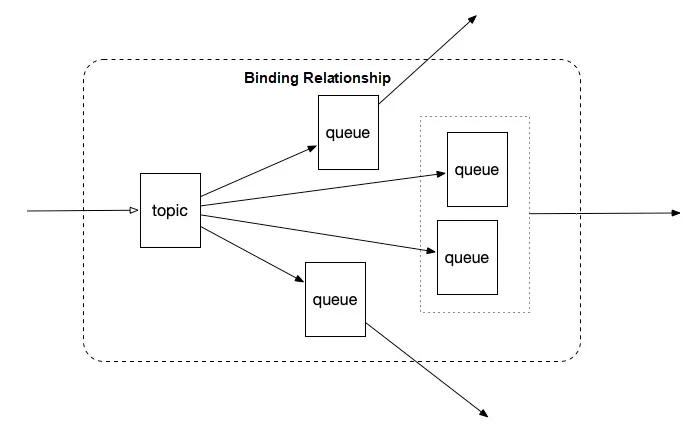
After that, we made two improvements. First, the topology could be declared in the configuration file of a service and, when the service started, the topology would be automatically declared in the RabbitMQ. Second, when the backend service on the merchant client received a message about a new order, the backend service performed polling. If the cache was hit, the backend service would send a request for the new order. If the cache was missed, the backend service would route the message to the primary database.
Therefore, the messaging topology was changed to the topology shown in the following figure.

2,593 posts | 794 followers
FollowAlibaba Clouder - November 2, 2020
Alibaba Clouder - November 2, 2020
Alibaba Clouder - November 2, 2020
Alibaba Clouder - November 2, 2020
Alibaba Clouder - November 2, 2020
Alibaba Developer - May 21, 2021

2,593 posts | 794 followers
Follow Black Friday Cloud Services Sale
Get started on cloud with $1. Start your cloud innovation journey here and now.
Learn More ApsaraDB for MyBase
ApsaraDB Dedicated Cluster provided by Alibaba Cloud is a dedicated service for managing databases on the cloud.
Learn More Architecture and Structure Design
Customized infrastructure to ensure high availability, scalability and high-performance
Learn MoreMore Posts by Alibaba Clouder