Object Storage Service (OSS) integrates with Simple Log Service (SLS) to collect, query, and analyze access logs for your buckets. Use real-time log query to audit access, track exception events, and troubleshoot issues directly from the OSS console.
How it works
When you enable real-time log query for a bucket, OSS automatically creates an SLS project and Logstore to store the access logs. Logs are pushed to the Logstore within 3 minutes of the request.
OSS bucket ──(access logs)──> SLS project / Logstore ──(query)──> ResultsFrom the OSS console, you can filter raw logs by bucket, object name, API operation, time range, or any other log field. SLS provides built-in analysis reports and supports SQL-like analysis statements for custom queries.
Billing
Real-time log query uses the SLS pay-by-feature billing mode. The following free quotas apply:
| Resource | Free quota | Overage billing |
|---|---|---|
| Log storage | Up to 7 days retention, with compressed write traffic or index traffic up to 900 GB per day | Billed as SLS log storage and index traffic fees |
| Shards | 16 x 31 shard-days per month | Billed as SLS active shard fees |
If each log entry is 1 KB, 900 GB is equivalent to approximately 900 million logs per day.
Additional SLS charges apply for reading data from the Logstore, processing log data, and delivering log data. For details, see Billable items of pay-by-feature.
Disabling real-time log query does not automatically delete the SLS project. To avoid unexpected charges, manually delete the project in the SLS console after disabling the feature. For more information, see Delete a project.
Enable real-time log query
Query logs
Prerequisites
Before you begin, make sure that you have:
A bucket with real-time log query enabled -- see Enable real-time log query
SLS authorized to access OSS -- if not yet authorized, complete the authorization on the Cloud Resource Access Authorization page
Procedure
Log on to the OSS console.
In the left-side navigation pane, click Buckets. On the Buckets page, find and click the target bucket.
In the left-side navigation tree, choose .
On the Real-time Log Query tab, enter a query statement and an analysis statement. Use the query syntax to filter logs and the analysis syntax to aggregate results. For a complete list of available fields, see Log fields.
Commonly queried fields
The following table lists the most frequently used log fields. For the complete field list, see Log fields.
| Field | Description | Example value |
|---|---|---|
bucket | Bucket name | examplebucket |
operation | API operation name | GetObject, PutObject |
client_ip | Client IP address | 192.0.2.1 |
http_status | HTTP response status code | 200, 403, 404 |
object | Object key | images/photo.jpg |
request_time | Request processing time (ms) | 120 |
__topic__ | Log topic identifier | oss_access_log |
Query examples
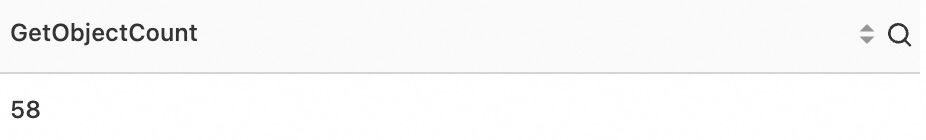
Count the number of GetObject operations on the bucket examplebucket over the past seven days:
* and __topic__: oss_access_log AND bucket:examplebucket AND operation:GetObject | select count(*) AS GetObjectCountSample result:
For more query examples, see Common examples of real-time log queries.