By Guqi
Observability is built on four key pillars of data from systems: metrics, logs, traces, and continuous profiling. From a macro to micro level, these interconnected data points provide capabilities such as data monitoring, issue analysis, and system diagnostics.

Java can leverage bytecode enhancement technologies to achieve non-intrusive application monitoring. There are numerous non-intrusive agent implementations available in the open-source community, which are very mature. This allows for easy acquisition of critical monitoring data. Compared with Java, due to the nature of the Go language, Go applications are compiled into binary files at runtime, making it impossible to perform dynamic instrumentation in a way similar to Java's bytecode enhancement. This means that the ecosystem for application monitoring in Go is not as well-developed, and the four pillars of observability cannot be achieved in a non-intrusive manner, increasing the cost for users to integrate monitoring. Currently, there are three solutions for observability in Go applications:
• SDK
• eBPF
• Compile-time automatic injection
The following describes these solutions and the corresponding open-source implementations.
In the observability domain, with OpenTracing being merged into OpenTelemetry, the widely adopted SDK nowadays is the OpenTelemetry SDK for Go. This method manually adds instrumentation points in your business code wherever necessary, as shown below:
package main

import (
  "context"
  "fmt"
  "go.opentelemetry.io/otel"
  "go.opentelemetry.io/otel/attribute"
  "go.opentelemetry.io/otel/sdk/trace"
  "io"
  "net/http"
)

func init() {
  tp := trace.NewTracerProvider()
  otel.SetTracerProvider(tp)
}

func main() {
  for {
    tracer := otel.GetTracerProvider().Tracer("")
    ctx, span := tracer.Start(context.Background(), "Client/User defined span")
    otel.GetTextMapPropagator()
    req, err := http.NewRequestWithContext(ctx, "GET", "http://otel-server:9000/http-service1", nil)
    if err != nil {
      fmt.Println(err.Error())
      continue
    }
    client := &http.Client{}
    resp, err := client.Do(req)
    if err != nil {
      fmt.Println(err.Error())
      continue
    }
    defer resp.Body.Close()
    b, err := io.ReadAll(resp.Body)
    if err != nil {
      fmt.Println(err.Error())
      continue
    }
    fmt.Println(string(b))
    span.SetAttributes(attribute.String("client", "client-with-ot"))
    span.SetAttributes(attribute.Bool("user.defined", true))
    span.End()
  }
}
First, define a TraceProvider. Then, at the point where you initiate a request, obtain a tracer and use tracer.Start to create a span. After initiating the request, call span.End() once the request has been completed.
This example demonstrates a simple HTTP request. For more complex applications, involving multiple calls, such as calls to Redis, MySQL, MQ, ES, and other middleware, you would need to instrument each call point. Additionally, you need to handle properly the pass-through of SpanContext and baggage, and call span.End() timely.
The SpanContext of OpenTelemetry is passed through the context as follows:
func testContext() {
  tracer := otel.Tracer("app-tracer")
  opts := append([]trace.SpanStartOption{}, trace.WithSpanKind(trace.SpanKindServer))
  rootCtx, rootSpan := tracer.Start(context.Background(), getRandomSpanName(), opts...)
  if !rootSpan.SpanContext().IsValid() {
    panic("invalid root span")
  }

  go func() {
    opts1 := append([]trace.SpanStartOption{}, trace.WithSpanKind(trace.SpanKindInternal))
    _, subSpan1 := tracer.Start(rootCtx, getRandomSpanName(), opts1...)
    defer func() {
      subSpan1.End()
    }()
  }()

  go func() {
    opts2 := append([]trace.SpanStartOption{}, trace.WithSpanKind(trace.SpanKindInternal))
    _, subSpan2 := tracer.Start(rootCtx, getRandomSpanName(), opts2...)
    defer func() {
      subSpan2.End()
    }()
  }()
  rootSpan.End()
}
rootCtx is used in the preceding two newly created goroutines. In this way, the spans created in the two goroutines become child spans of the root span. The context in business code needs to be passed in a similar method; otherwise, trace segments would be disconnected or misaligned.
At the same time, OpenTelemetry SDK for Go currently releases new versions every two to four weeks.
For more information, see https://github.com/open-telemetry/opentelemetry-go/releases. The fast update pace often results in backward-incompatible changes. In addition, the upgrade of OpenTelemetry SDK for Go also requires modifications to your code, which can be costly.
eBPF (Extended Berkeley Packet Filter), an efficient and flexible virtual machine within the Linux kernel, allows developers to write custom programs that can be loaded into the kernel space through specific interfaces for execution. This capability makes eBPF one of the ideal choices for building various system monitoring solutions.
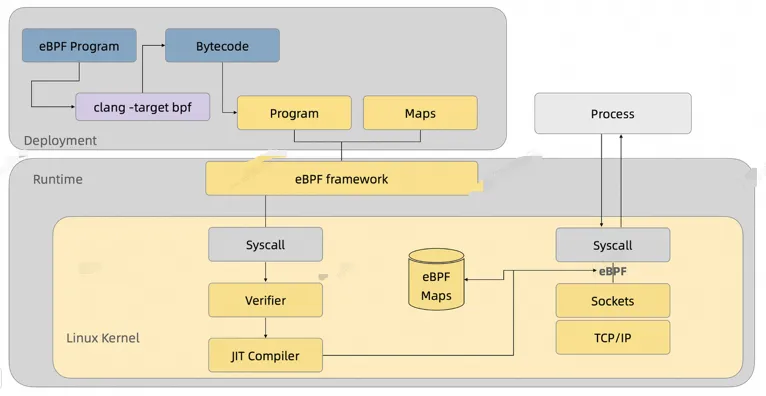
In recent years, a multitude of open-source projects based on eBPF technology have emerged, including:
• Pixie
• Beyla
• OpenTelemetry Go Instrumentation
• Deepflow
and many other well-known projects. These projects aim to harness the powerful capabilities of eBPF to achieve functionalities such as performance profiling, network monitoring, metric collection, and distributed tracing.
eBPF can capture data flows by attaching at different mount points like tracepoints or kprobes, and it can also use uprobes to hook user-space functions. For instance, when it comes to protocol parsing, with the increasing complexity of services and diverse requirements across scenarios, there are numerous user-space protocols such as RPC types like HTTP, HTTPS, gRPC, Dubbo, and middleware protocols like MySQL, Redis, ES, MQ, CK, and so on. It is quite challenging to parse the data captured by eBPF and realize the statistics of metrics.
Taking the monitoring of Go applications with eBPF as an example, due to its distinctive concurrency model that widely adopts asynchronous processing, precise cross-goroutine context passing or fine-grained tracking deep within the application typically requires additional SDK support to facilitate context passing between goroutines.
While the above projects share some functional similarities, eBPF has certain limitations, such as being restricted to Linux environments with elevated permissions and having kernel version dependencies. In particular scenarios, especially those involving complex application-layer logic tracing, relying solely on eBPF might not yield the desired outcomes.
In terms of performance overhead, eBPF lags slightly behind in-process agents since triggering uprobes necessitates context switching between user space and the kernel, which can be challenging for highly accessed interfaces.
Before adopting this approach, we explored extensively with the eBPF solution, aiming to use eBPF as a one-size-fits-all answer for monitoring issues across non-Java languages, especially for Go applications (the most widely used language outside of Java today). After prolonged exploration, it became clear that achieving comprehensive, seamless monitoring capabilities like those available for Java was not feasible. This realization prompted us to consider alternative methods. Based on Go's toolexec capability, implementing compile-time instrumentation for Go application monitoring became a viable option.
The compilation process of a Go application is as follows:

Using a simple go build command yields the final executable binary file. The go build process is as follows:
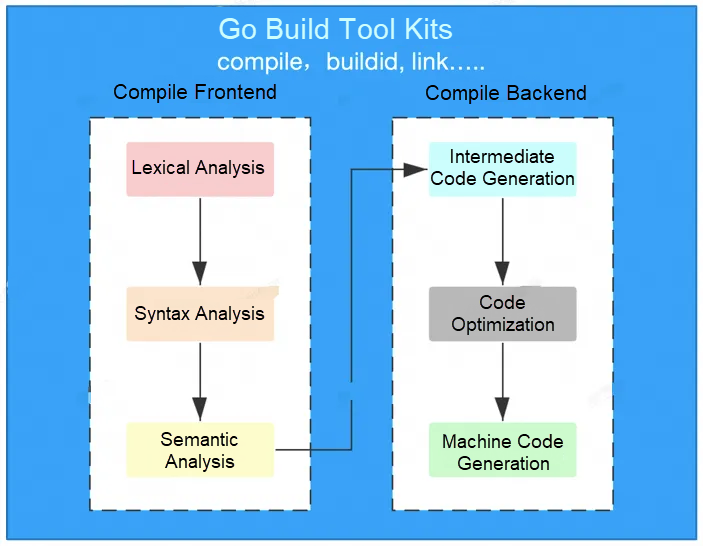
Lexical and syntactic analysis generates intermediate .a files. These .a files are ultimately linked to produce the binary file. According to this process, you may find that you can hook into the compilation pipeline between the front end and back end. Therefore, the compilation flow is modified as follows:
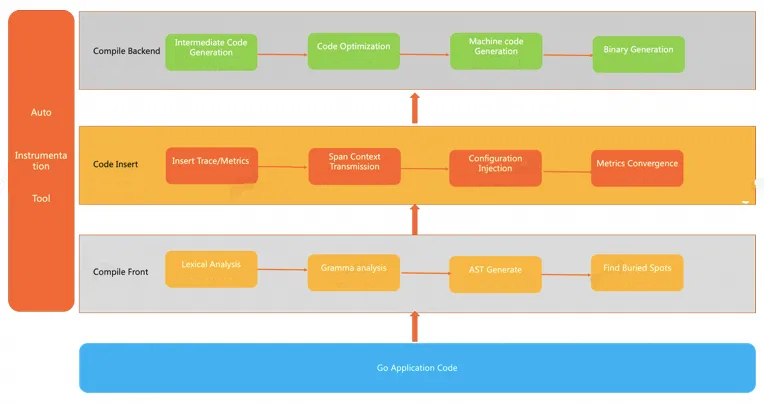
By analyzing the Abstract Syntax Tree (AST), you can locate instrumentation points according to predefined rules and insert the necessary monitoring code before compilation. You can then inject the monitoring code into the final binary through the complete Go compilation process. This method is no different from manually written code by developers since it undergoes the full compilation process, minimizing the risk of unexpected errors.
To use Alibaba Cloud OpenTelemetry Golang Agent, you only need to download a compilation tool named instgo and modify the compilation statement, as shown in the following figure.
Current compilation statement:
Current compilation statement:

CGO_ENABLED=0 GOOS=linux GOARCH=amd64 go build main.go

Use Alibaba Cloud OpenTelemetry Golang Agent:

wget "http://arms-apm-cn-hangzhou.oss-cn-hangzhou.aliyuncs.com/instgo/instgo-linux-amd64" -O instgo
chmod +x instgo
CGO_ENABLED=0 GOOS=linux GOARCH=amd64 ./instgo go build main.go
By using wget to download the instgo compiler and simply adding instgo before your go build command, you can quickly inject monitoring capabilities into your application.
With this approach, we achieve comprehensive monitoring capabilities similar to those of Java applications, including tracing analysis, metrics collection, continuous profiling, dynamic configuration, code hotspots analysis, log-trace correlation, and more. In terms of plugin richness, Alibaba Cloud OpenTelemetry Golang Agent supports over 40 common plugins [4], covering RPC frameworks, databases, caches, message queues, logging, and more. In terms of performance, with just a 5% overhead, it can support up to 1,000 queries per second [5]. Additionally, its features like dynamic switch control and canary release for new versions ensure production availability and risk management.
| SDK | Compile-time Instrumentation | eBPF | |
|---|---|---|---|
| Usability | Low | High | High |
| Feature | Tracing analysis | Tracing analysis, metrics collection, profiling, log-trace correlation, code hotspots analysis | Tracing analysis (depends on SDK), metrics (depends on plugin richness), profiling |
| Performance | High | High | Low |
| Reliability & Security | High | High | Low |
| Data Richness | Low | High | Low |
| Scalability | Low | High, support for custom extensions [6] | Low |
| Runtime Environment | Common OS supported | Common OS supported | Linux |
This article describes why the Alibaba Cloud Compiler Team and Observability Team chose compile-time instrumentation to monitor Go applications. It also introduces other monitoring solutions and their advantages and disadvantages. We believe that Alibaba Cloud OpenTelemetry Golang Agent (Instgo) is a very powerful tool that can help us achieve better APM capabilities for Go applications while maintaining application security and reliability.
To promote the compile-time instrumentation solution and provide Go developers with more options to boost efficiency, we have open-sourced the Alibaba Cloud OpenTelemetry Golang Agent [7]. We welcome everyone to join our DingTalk groups (Open Source Group: 102565007776, Commercial Group: 35568145) to collectively enhance the capability of compile-time instrumentation in monitoring Go applications.
[1] https://github.com/open-telemetry/opentelemetry-java
[2] https://github.com/open-telemetry/opentelemetry-go
[3] Monitoring Golang applications: https://www.alibabacloud.com/help/en/arms/application-monitoring/user-guide/monitoring-the-golang-applications/
[4] Golang components and frameworks supported by ARMS application monitoring: https://www.alibabacloud.com/help/en/arms/application-monitoring/developer-reference/go-components-and-frameworks-supported-by-arms-application-monitoring
[5] Golang probe performance stress test report: https://www.alibabacloud.com/help/arms/application-monitoring/developer-reference/golang-probe-performance-pressure-test-report
[6] Non-intrusive instrumentation Technology for Go applications
[7] https://github.com/alibaba/opentelemetry-go-auto-instrumentation
How to Solve the Occasional 404 Error After Enabling HTTP/2 in Envoy?

686 posts | 56 followers
FollowAlibaba Cloud Native Community - August 5, 2025
Alibaba Cloud Native Community - August 19, 2025
Alibaba Cloud Native Community - April 29, 2024
Alibaba Cloud Native Community - March 11, 2026
OpenAnolis - December 24, 2024
Alibaba Cloud Native Community - November 18, 2024

686 posts | 56 followers
Follow Simple Log Service
An all-in-one service for log-type data
Learn More Cloud-Native Applications Management Solution
Accelerate and secure the development, deployment, and management of containerized applications cost-effectively.
Learn More Intelligent Robot
A dialogue platform that enables smart dialog (based on natural language processing) through a range of dialogue-enabling clients
Learn More Lindorm
Lindorm is an elastic cloud-native database service that supports multiple data models. It is capable of processing various types of data and is compatible with multiple database engine, such as Apache HBase®, Apache Cassandra®, and OpenTSDB.
Learn MoreMore Posts by Alibaba Cloud Native Community